'Recovery' from chronic fatigue syndrome after treatments given in the PACE trial

Sam Carter

Guest
Messages
435
Psy Med 2013 says:

""""""""""""
CFS case definition : Oxford criteria

This was the definition of CFS used to define eligibility for participation in the trial. Research assessors judged whether participants still met Oxford criteria for CFS at 52 weeks; specifically they determined if : (1) fatigue was the main symptom, (2) it was of definite onset and not lifelong, (3) fatigue was severe, disabling and affected physical and mental function, and (4) fatigue had persisted for 6 months or more and was present 50% of the time (Sharpe et al. 1991). To satisfy the third criterion for severity of fatigue and disability, participants had to meet trial entry thresholds for fatigue (a binary score of >6 out of 11 on the CFQ) and abnormal levels of physical function (a score of <=65 out of 100 on the SF-36 physical function subscale) (White et al. 2007).
""""""""""""""

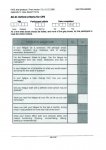
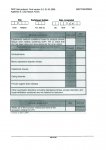
I can't find anything in White el al 2007 to suggest that satisfying the Oxford Criteria was quantified in terms of SF-36 and CFQ scores.
 

Attachments

  • Oxford Criteria p189.jpg
    Oxford Criteria p189.jpg
    926.3 KB · Views: 47
  • Oxford Criteria 190.jpg
    Oxford Criteria 190.jpg
    877.8 KB · Views: 88

Dolphin

Senior Member
Messages
17,567
Psy Med 2013 says:

""""""""""""
CFS case definition : Oxford criteria

This was the definition of CFS used to define eligibility for participation in the trial. Research assessors judged whether participants still met Oxford criteria for CFS at 52 weeks; specifically they determined if : (1) fatigue was the main symptom, (2) it was of definite onset and not lifelong, (3) fatigue was severe, disabling and affected physical and mental function, and (4) fatigue had persisted for 6 months or more and was present 50% of the time (Sharpe et al. 1991). To satisfy the third criterion for severity of fatigue and disability, participants had to meet trial entry thresholds for fatigue (a binary score of >6 out of 11 on the CFQ) and abnormal levels of physical function (a score of <=65 out of 100 on the SF-36 physical function subscale) (White et al. 2007).
""""""""""""""

I can't find anything in White el al 2007 to suggest that satisfying the Oxford Criteria was quantified in terms of SF-36 and CFQ scores.
Well here's the entry criteria:


Inclusion criteria

1. Both participant and clinician agree that randomisation is acceptable.
2. The participant has given written informed consent.
3. The participant meets operationalised Oxford research diagnostic criteria for CFS [2].
4. The participant's Chalder Fatigue Questionnaire score is 6 or more [27].
5. The participant's SF-36 physical function sub-scale score [28] is 65 or less.
6. The participant is aged at least 18 years old.
http://www.biomedcentral.com/1471-2377/7/6
 

Sam Carter

Guest
Messages
435
Well, the Oxford criteria were the entry criteria and they say this:


http://www.biomedcentral.com/1471-2377/7/6
Well, the Oxford criteria were the entry criteria and they say this:


http://www.biomedcentral.com/1471-2377/7/6

Not sure I understand your point, D.

If the Oxford Criteria was specified in terms of particular SF-36 and CFQ scores then there would be no need to include "4. The participant's Chalder Fatigue Questionnaire score is 6 or more [27]. 5. The participant's SF-36 physical function sub-scale score [28] is 65 or less." in the eligibility criteria because a quantified version of Oxford would render these stipulations redundant.
 

Dolphin

Senior Member
Messages
17,567
Not sure I understand your point, D.

If the Oxford Criteria was specified in terms of particular SF-36 and CFQ scores then there would be no need to include "4. The participant's Chalder Fatigue Questionnaire score is 6 or more [27]. 5. The participant's SF-36 physical function sub-scale score [28] is 65 or less." in the eligibility criteria because a quantified version of Oxford would render these stipulations redundant.
I saw and see the logical point you were making

I think it could be standard enough not to have that ticksheet as sufficient to meet the Oxford criteria i.e. one would add on one or more scales to check it.

It may have simply been a difficult thing to word in the protocol.

Do you think it's important?
 

Esther12

Senior Member
Messages
13,774
I'm not sure your point in your second last sentence, "that their 'recovery' .... ?

[these figures are from memory - I think that they're right, but don't quote me!]
Edit: I got the figures right, but my point was wrong!
...

As a piece of politics, I think that the PACE recovery paper was very good and clever.
 

Graham

Senior Moment
Messages
5,188
Location
Sussex, UK
But we still have to keep at the front of our minds that we are talking about the way in which patients filled in questionnaires, having been "trained" that they are not as ill as they think they are. It could easily be argued, with the lack of supportive objective evidence, that that is all it showed: that some people were more susceptible to the pressures put on them to minimise their perception of their difficulties. I'm not denying that some people will really have shown some benefit from these therapies, just that there is no objective evidence: the percentages could be tiny.

A dozen sessions of brainwashing!

I know I'm not contributing to the discussion on measures of recovery, but I do feel that we need to include something in any "official" communications that the improvements are only in answers to questionnaires. What other illness would measure recovery in that way? "Yes I had a better week last week." "You have recovered from diabetes/lupus/MS/heart disease/..."
 

Dolphin

Senior Member
Messages
17,567
[these figures are from memory - I think that they're right, but don't quote me!]

They were classing 28-30% of people as 'back to normal', with this being widely viewed as meaning recovered and cured (by the Lancet and BMJ). That the change of excluding people who still fulfilled their criteria for CFS led to a drop of about 8% shows that nearly a third of those who were described as 'back to normal' still fulfilled the criteria for CFS (this is complicated by other minor changes too, eg the self rated Global Change score, but as about 40% of patients fulfilled this criteria, it's unlikely that this was a major cause of the drop.... The complexity of the criteria makes it really difficult to concisely and accurately criticise it!).
Table 1 (b) looks at the issue. To be exact, it was the CGI that was the bigger reason the "normal" values dropped (see change from 2nd row to 3rd row). Not satisfying the Oxford criteria had a minimal effect (see change from 1st row to 2nd row).

As a piece of politics, I think that the PACE recovery paper was very good and clever.
Agree with you.
 

Dolphin

Senior Member
Messages
17,567
But we still have to keep at the front of our minds that we are talking about the way in which patients filled in questionnaires, having been "trained" that they are not as ill as they think they are. It could easily be argued, with the lack of supportive objective evidence, that that is all it showed: that some people were more susceptible to the pressures put on them to minimise their perception of their difficulties. I'm not denying that some people will really have shown some benefit from these therapies, just that there is no objective evidence: the percentages could be tiny.

A dozen sessions of brainwashing!

I know I'm not contributing to the discussion on measures of recovery, but I do feel that we need to include something in any "official" communications that the improvements are only in answers to questionnaires. What other illness would measure recovery in that way? "Yes I had a better week last week." "You have recovered from diabetes/lupus/MS/heart disease/..."
It is an important point. And we do have a trial of a similar form of CBT in MS that led to much more dramatic drops in fatigue/fatigue reported which would be good to get mentioned in a letter.
 

user9876

Senior Member
Messages
4,556
But we still have to keep at the front of our minds that we are talking about the way in which patients filled in questionnaires, having been "trained" that they are not as ill as they think they are. It could easily be argued, with the lack of supportive objective evidence, that that is all it showed: that some people were more susceptible to the pressures put on them to minimise their perception of their difficulties. I'm not denying that some people will really have shown some benefit from these therapies, just that there is no objective evidence: the percentages could be tiny.

A dozen sessions of brainwashing!

I know I'm not contributing to the discussion on measures of recovery, but I do feel that we need to include something in any "official" communications that the improvements are only in answers to questionnaires. What other illness would measure recovery in that way? "Yes I had a better week last week." "You have recovered from diabetes/lupus/MS/heart disease/..."

It's not just form filling. I assume in making an assessment about the various diagnostic criteria the research assessors are asking questions about symptoms. Some who have been told how you feel is normal everyone gets tired may well play down fatigue (and pain) hence not meet the oxford criteria.
 

Esther12

Senior Member
Messages
13,774
Table 1 (b) looks at the issue. To be exact, it was the CGI that was the bigger reason the "normal" values dropped (see change from 2nd row to 3rd row). Not satisfying the Oxford criteria had a minimal effect (see change from 1st row to 2nd row).
Agree with you.

Thanks Dolphin. I'd not noticed that on my first read. Interesting that adding the CGI criteria halves the 'recovery rate' of APT+SMC and SMC alone.
 

Dolphin

Senior Member
Messages
17,567
I thought I'd highlight that one can get a little extra information from rows 1-3 in Table 1 (a) and give the actual numbers.


APT (159):

22% (34/153): Fatigue Within CFQ normal range:

35% (53/153): Physical function Within SF-36-PF normal range

16% (25/153): Both fatigue and function Within normal range

is equivalent to:

Both in normal range:
16% (25/153): Fatigue >18 (Likert) and Physical function >=60

Just one in normal range (within one SD):
6% (9/153): Fatigue <=18 (Likert) and Physical function <60
18% (28/153): Fatigue >18 (Likert) and Physical function >=60

Neither in normal range (within one SD)
59% (91/153): Fatigue >18 (Likert) and Physical function <60


---------------------------------

CBT (161):

41% (60/148)Fatigue Within CFQ normal range:

52% (77/148) Physical function Within SF-36-PF normal range

30% (44/148) Both fatigue and function Within normal range

is equivalent to:

Both in normal range:
30% (44/148): Fatigue >18 (Likert) and Physical function >=60

Just one in normal range (within one SD):
11% (16/148): Fatigue <=18 (Likert) and Physical function <60
22% (33/148): Fatigue >18 (Likert) and Physical function >=60

Neither in normal range (within one SD)
37% (55/148): Fatigue >18 (Likert) and Physical function <60


--------------------------------


GET (160)

33% (51/154) Fatigue Within CFQ normal range:

53% (81/154) Physical function Within SF-36-PF normal range

28% (43/154) Both fatigue and function Within normal range

is equivalent to:

Both in normal range:
28% (43/154): Fatigue >18 (Likert) and Physical function >=60

Just one in normal range (within one SD):
5% (8/154): Fatigue <=18 (Likert) and Physical function <60
25% (38/154): Fatigue >18 (Likert) and Physical function >=60

Neither in normal range (within one SD)
42% (65/154): Fatigue >18 (Likert) and Physical function <60


-----------

SMC (160)

21% (32/152) Fatigue Within CFQ normal range:

41% (62/152) Physical function Within SF-36-PF normal range

14% (22/152): Both fatigue and function Within normal range

is equivalent to:

Both in normal range:
14% (22/152): Fatigue >18 (Likert) and Physical function >=60

Just one in normal range (within one SD):
6% (10/152): Fatigue <=18 (Likert) and Physical function <60
26% (40/152): Fatigue >18 (Likert) and Physical function >=60

Neither in normal range (within one SD)
53% (80/152): Fatigue >18 (Likert) and Physical function <60
 

Dolphin

Senior Member
Messages
17,567
Apologies if this point has been made before:

Overall health change CGI 1 or 2 ("very much better" or "much better"):
30 (48/158) 40 (62/154) 40 (63/156) 25 (40/158)

However, when one goes down through the scores, it becomes clear that quite a lot of those who gave their CGI score as 1 or 2, had poor scores (outside normal range) for either CFQ or the SF-36 PF or both.

One can't work out exact figures, but I think it's reasonable to do these approximations:
-----------------
APT:
30% CGI 1 or 2.

Max. 16% of them within both CFQ and SF-36-PF normal ranges (row 1, Table 1 (b)).

However, we have more information going from row 2 to row 3 i.e. at least 7% have CGI scores of 3-7 but within both CFQ and SF-36-PF normal ranges

--> means max 9% (=16-7) of the 30% with CGI 1 or 2 i.e. approximately 70+% of those gave their CGI score as 1 or 2 ("very much better" or "much better") following APT, have poor scores (outside normal range) for either CFQ or the SF-36 PF or both.

----------------

CBT:
40% CGI 1 or 2

Max. 30% of them within both CFQ and SF-36-PF normal ranges (row 1, Table 1 (b)).

However, we have more information going from row 2 to row 3 i.e. at least 6% have CGI scores of 3-7 but within both CFQ and SF-36-PF normal ranges

--> means max 24% =(30-6) of the 40% with CGI 1 or 2 i.e. approximately 40+% of those gave their CGI score as 1 or 2 ("very much better" or "much better") following APT, have poor scores (outside normal range) for either CFQ or the SF-36 PF or both.

----------------

GET:
40% CGI 1 or 2


Max. 28% of them within both CFQ and SF-36-PF normal ranges (row 1, Table 1 (b)).

However, we have more information going from row 2 to row 3 i.e. at least 6% have CGI scores of 3-7 but within both CFQ and SF-36-PF normal ranges

--> means max 22% =(28-6) of the 40% with CGI 1 or 2 i.e. approximately 45+% of those gave their CGI score as 1 or 2 ("very much better" or "much better") following APT, have poor scores (outside normal range) for either CFQ or the SF-36 PF or both.

----------

SMC:
25% CGI 1 or 2


Max. 15% of them within both CFQ and SF-36-PF normal ranges (row 1, Table 1 (b)).

However, we have more information going from row 2 to row 3 i.e. at least 7% have CGI scores of 3-7 but within both CFQ and SF-36-PF normal ranges

--> means max 8% =(15-7) of the 25% with CGI 1 or 2 i.e. approximately 68+% of those gave their CGI score as 1 or 2 ("very much better" or "much better") following APT, have poor scores (outside normal range) for either CFQ or the SF-36 PF or both.

-----------------
A numerical average is 55.75%

However, that ignores the fact that the number of individuals involved are bigger for CBT and GET.

If base the figures on the numbers with CGI scores of 1 or 2, it would be
(48*70%)+(62*40%)+(63*45%)+(40*68%)/48+62+63+40= 33.6+24.8+28.35+27.2/213= 113.95/213=53.5%

i.e. approximately 53.5% overall of those gave their CGI score as 1 or 2 ("very much better" or "much better"), did not satisfy one or both of the following:

within SF-36 PF normal range

within CFQ normal range

Presumably those who gave CGI scores of 1 did better than those who gave CGI scores of 2.

So probably 60+%, of those gave their CGI score 2 ("very much better" or "much better"), did not satisfy one or more of the following:

within SF-36 PF normal range (>=60)

within CFQ normal range (<=18)

This suggests it is not a good recovery criterion, using their own definition of "recovery".

Using the term "specificity", It means a CGI score of 2 would have 40% (or less) specificity for ensuring all of the following are met:

(i) within SF-36 PF normal range (>=60)

(ii) within CFQ normal range (Likert) (<=18)

If one had a stricter recovery definition, for example SF-36 PF >=85 and CFQ (bimodal) <=3, one could imagine that the figures would be much worse, probably much much worse, again.

=====================================
(These figures below aren't a whole lot different i.e. the "Oxford criteria not met" criterion doesn't affect too much the numbers we have access to).

If one looks at: "Overall health change CGI 1 or 2" vs
"Overall health change CGI 1 or 2"
+Oxford Criteria not met
+ within SF-36 PF normal range
+ within CFQ normal range
there is quite a difference:

APT: 30% vs 8%
CBT: 40% vs 22%
GET: 40% vs 22%
SMC: 25% vs 7%
(the denominators are different so will just approximate).

This means that:

- (i) with APT
(30-8%)=22/30 =73.3333% of those who put CGI of 1 or 2 did not satisfy one or more of the following:
Oxford Criteria not met
or
within SF-36 PF normal range
or
within CFQ normal range

- (ii) with CBT:
(40-22)=18/40=45% of those who put CGI of 1 or 2 did not satisfy one or more of the following:

Oxford Criteria not met
or
within SF-36 PF normal range
or
within CFQ normal range

- (iii) with GET:
(40-22)=18/40=45% of those who put CGI of 1 or 2 did not satisfy one one or more of the following:

Oxford Criteria not met
or
within SF-36 PF normal range
or
within CFQ normal range

- (iii) with SMC:
(25-7)=18/25=72% of those who put CGI of 1 or 2 did not satisfy one or more of the following:

Oxford Criteria not met
or
within SF-36 PF normal range
or
within CFQ normal range

A numerical average is 58.8%

However, that ignores the fact that the number of individuals involved are bigger for CBT and GET.

If base the figures on the numbers with CGI scores of 1 or 2, it would be
(48*73.33333%)+(62*45%)+(63*45%)+(40*72%)/48+62+63+40= 35.2+ 27.9+28.35+28.8/213=120.25/213=56.5%

i.e. approximately 56.6% overall of those gave their CGI score as 1 or 2 ("very much better" or "much better"), did not satisfy one or more of the following:

Oxford Criteria not met
or
within SF-36 PF normal range
or
within CFQ normal range

Presumably those who gave CGI scores of 1 did better than those who gave CGI scores of 2.

So probably 60%, maybe 70+% of those gave their CGI score 2 ("very much better" or "much better"), did not satisfy one or more of the following:

Oxford Criteria not met (i.e. they still satisfied the Oxford criteria)
or
within SF-36 PF normal range
or
within CFQ normal range.

This suggests it is not a good recovery criterion, using their own definition of "recovery".

Using the term "specificity", It means a CGI score of 2 would have 30-40% (or less) specificity for ensuring all of the following are met:

(i) Oxford Criteria not met

(ii) within SF-36 PF normal range

(iii) within CFQ normal range.

If one had a stricter recovery definition, for example SF-36 PF >=85 and CFQ (bimodal) <=3, one could imagine that the figures would be much worse, probably much much worse, again.
 

Esther12

Senior Member
Messages
13,774
One of the irritating things about posting on this forum is that I now have a record of my thoughts about my health.

I kept stumbling upon old posts from myself about how I'd found the pilates was leading to some significant improvement, or the use of a balance ball, or a new way of managing activity levels... but looking back over the long run I hadn't actually got any better. I still think some of these things are sensible things to do, but I now see how much of my own sense of improvement was deluded, or just founded upon the optimism that comes with trying something new.

It would be interesting to know how many people class themselves as 'much better' following homeopathy. Being 'much better' sounds really good, but it's difficult to know how well this self-rating correlates with actual improvement. This is probably why their initial criteria for recovery required people to class themselves as 'very much better'.

I wonder how these self-ratings correlate with data on disability benefits, 6mwt, etc, etc. Also... if you've recieved 'care' from a therapist who you like and think is trying to help, it's natural to want to be positive about any improvements you may have had (obvious point, made many times before... I'm stepping away from the PC now).
 

Dolphin

Senior Member
Messages
17,567
One of the irritating things about posting on this forum is that I now have a record of my thoughts about my health.

I kept stumbling upon old posts from myself about how I'd found the pilates was leading to some significant improvement, or the use of a balance ball, or a new way of managing activity levels... but looking back over the long run I hadn't actually got any better. I still think some of these things are sensible things to do, but I now see how much of my own sense of improvement was deluded, or just founded upon the optimism that comes with trying something new.

It would be interesting to know how many people class themselves as 'much better' following homeopathy. Being 'much better' sounds really good, but it's difficult to know how well this self-rating correlates with actual improvement. This is probably why their initial criteria for recovery required people to class themselves as 'very much better'.

I wonder how these self-ratings correlate with data on disability benefits, 6mwt, etc, etc. Also... if you've recieved 'care' from a therapist who you like and think is trying to help, it's natural to want to be positive about any improvements you may have had (obvious point, made many times before... I'm stepping away from the PC now).
Yes. I don't mind patients saying it. And indeed, the percentages were lower than the 60% improvement rate they like the PIs like to quote.
It's the researchers deciding to change the pre-specified recovery outcome measure to include a CGI of 2 I have problems with. To use the jargon, a CGI of 2 lacks specificity for detecting a very good final outcome (specificity being the jargon word, "very good final outcome" is not!)
 

Graham

Senior Moment
Messages
5,188
Location
Sussex, UK
But I am "very much better" than I was two years after getting ME. It took 18 months to see a specialist and get a diagnosis (yes, I know I am lucky), which in turn led to me getting early retirement. Prior to that I was struggling to work. So when I finally quit, I found it difficult to walk more than 100 yards, and that was at the speed of an elderly person. I was able to do so very little. Over the following year though, things gradually improved, and now I can take the dog out for a walk for half to three-quarters of an hour each day. I would describe that as much better, even very much better, but still far from well. How many of the patients were in that situation? That this was their first visit to a specialist, their first official diagnosis, and their first opportunity to properly stop work? The SMC group clearly had people in it who felt that they had improved a lot. How much effect would CBT have in persuading more people in that position to choose "very much better" or "much better" as descriptors?
 

Valentijn

Senior Member
Messages
15,786
I think I've just realised something important.
I had thought that people had to score >65 on the SF-36 physical functioning scale AND <6 on the Chalder Fatigue Scale for the Oxford criteria not to be met.
However, if that was the case, one would have expected the scores to drop more from the first line to the second line of Table 1 (b).

If you're talking about what I think you are, then I think you're right. They talk about entry criteria requiring certain scores and requiring patients to meet the Oxford criteria in the same breath, but I don't think they're integrating those required scores into their definitions of the Oxford criteria. So then for "recovery" I don't think they're necessarily including those fatigue or SF-36 scores when they say someone must no longer meet the Oxford criteria.
 

Valentijn

Senior Member
Messages
15,786
It's the researchers deciding to change the pre-specified recovery outcome measure to include a CGI of 2 I have problems with. To use the jargon, a CGI of 2 lacks specificity for detecting a very good final outcome (specificity being the jargon word, "very good final outcome" is not!)

Another issue with the expanded CGI score might be that people are willing to exaggerate a bit to make someone happy, but are less willing to make a more outrageous exaggeration. So if a bunch of patients really felt they were unchanged or minimally improved, they might have been okay with saying they're "much improved" but would feel that "very much improved" (as the best option available) would be going too far from reality. So by expanding the scoring to include "much better", you might get a lot more exaggerators than you find with just counting the very best rating.

Just a theory. Too bad theories are all we have with a complete lack of objective recovery data!
 
Messages
445
Location
Georgia
One of the irritating things about posting on this forum is that I now have a record of my thoughts about my health.

I kept stumbling upon old posts from myself about how I'd found the pilates was leading to some significant improvement, or the use of a balance ball, or a new way of managing activity levels... but looking back over the long run I hadn't actually got any better. I still think some of these things are sensible things to do, but I now see how much of my own sense of improvement was deluded, or just founded upon the optimism that comes with trying something new.
.

Esther,

Nothing to be ashamed of there. My conditions change constantly. Some days it is intense agitation and pain; a week later it is total brain fog, and a feeling of other-worldliness; later on it's total sleeplessness and intensified fatigue; sometimes its dizzyness and dysautonomia. The more things change, they more they stay the same with CFS. When I go to a doc, and they hand me one of those check sheets that asks "in the last week have you felt XYZ one time, three times, five times" I quickly realize he doesn't have clue. Putting order to a mysterious diseasee is really hard. Must be frustrating for them, as much as us.
 

kaffiend

Senior Member
Messages
167
Location
California
But we still have to keep at the front of our minds that we are talking about the way in which patients filled in questionnaires, having been "trained" that they are not as ill as they think they are. It could easily be argued, with the lack of supportive objective evidence, that that is all it showed: that some people were more susceptible to the pressures put on them to minimise their perception of their difficulties. I'm not denying that some people will really have shown some benefit from these therapies, just that there is no objective evidence: the percentages could be tiny.

It's known as social desirability bias and there are countless studies demonstrating it. The website below does a good job of detailing the problems with self-reports.

http://www.sciencebrainwaves.com/uncategorized/the-dangers-of-self-report/

Even an undergraduate psychology project would have to account for it in order to be acceptable, never-mind published in a peer-reviewed journal. Self-reports are cheap and so they are overused, but generally should be used only if there's no other way to get at the answer, i.e., we're studying introversion or some such thing. When reporting on physical disability, the means to obtain objective measures are widely available. Also, the authors' line about work being dependent upon the economy is weak. There are many ways to ask that question.
 
Back