I am trying to share research on the "hypermetabolic" state rather the the hypometabolic conclusion of Prusty and Naviaux.
So, it's funny you ask, because it's one of the few things I've commented on several times in the past...
I've not looked at that 2020 Missailidis paper [
mdpi], yet. But I read into the 2019 paper that you linked in your [
previous comment], by McGregor and Armstrong, etc - PEM associated with hypermetabolism [
mdpi], at the time... [
PhoenixRising] thread, too.
I've now totally forgotten the lay of the metabolites, pathways and enzymes for the 5th time; all just a soup of arbitrary names running through my sieve-brain again, so I'm mostly generalising from vague notions, here (so as always correct me!)... But I commented on
Cort's article explaining the research (I'm pretty much the only person with an avatar pic on there, heh):
I think your talk of “hypermetabolic” states may be a little confusing for some. Given Naviaux described ME/CFS as hypometabolic and dauer like.
I don’t *think* there’s any contradiction here, is there? It’s *just* the anaerobic metabolism that is hyper-active. Reduced glucose metabolism causing (presumably?) the observed amino acid depletion. And all the other types of lowered metabolites too…?
So hypo/hyper are two sides of the same shift in energy metabolism:
•
Reduced (
hypo) use of oxygen in mitochondria for oxidative phosphorylation (electron transport chain, etc with lactic acid as an end-point).
•
Increased (
hyper) anaerobic glycolysis, which is far less efficient, way more resource intensive and so catabolic (muscle breakdown).
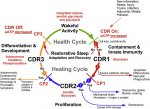
In Naviaux's terms, I believe the cells in Prusty's lab experiment were in the CDR1 state, because he talks about "M1-proinflammatory form of mitochondria". Fig.2 from "
Cell danger response Biology—The new science[...]" [
ScienceDirect]:
CDR states linked to their energy metaboloism type in Fig.1 of same paper (don't worry about other details):

Note, that I'm not sure what form of mitochondria are normal for the cancer cell lines... As they are probably in a perpetual state of rapid growth, I'd guess M0 - aerobic glycolysis...?
It's one of the questions I wanted to ask Prusty, as they never mention the different CDR numbers in the latest paper, despite being a colaboration with Naviaux. (Incidentally, Cort said he conferred with Naviaux, not Prusty, in doing
his write-up.)
If the M0 type mitochondria seen in the HHV-6 experiments are representative of ME/CFS, then I'm wondering if Naviaux had CFS mis-categorised as a CDR3 disease (see row D of above diagram). Or if the categories themselves need adjustment...?
Going back to energy production. A 2016 paper by Lawson et al. saw "
Elevated Energy Production in Chronic Fatigue SyndromePatients" [
jnsci]. [
PhoenixRising] thread. Again, there was no contradiction with hypometabolism, they had just washed the patient's (immune) blood cells and given them a medium in which they then thrived (something Prusty mentions in passing in his video talk, embedded above). Principle author, Xinnan Wang, replied to my emailed question:
(3) Was the team aware of the potential for altering the PBMN cell's characteristics by having them in a growth medium (for 2-3 days, was it?), free of any factors that might be found in subject's serum? (The word from a number of metabolomics researchers is that they are sure there is something in patient's blood that is inhibiting mitochondria and are now trying to isolate this factor(s).)
Yes of course these cells are very different from in vivo. However, as explained in the background this was the only option at the time and even if cultured in vitro these cells are still useful for studying mitochondrial function and ultrastructure.
So, greatly increased glycolysis, which
Cort's write up talked more about. With slightly less than normal ATP from mitochondria, but double the normal from outside the mitos (glycolytically):
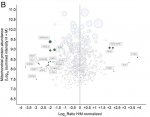
Prusty's new study saw only a modestly lower overall ATP production (below). Different tissue types of the cells, of course. I think they decided (unless I'm misinterpreting) the overall ~2x rise (above), entirely from glycolysis, might be due to patient's immune cell's ongoing activation. Changes previously hidden, in vivo, suppressed by the serum factor...?
[Fig.5C - A549 cells cultured in respective serum]
Again, I don't know how much this modest difference in cellular ATP levels would be reflected in (non-cancerous) patient cells... M2 mitos produce a lot more ATP than M0 would (which are geared towards structural metabolites, etc, instead).
I'm also not sure how much one would expect to see the ATP levels drop, in practice...? Such an important metabolite, would a cell that can't make enough quickly start slowing or shutting down uses of it, triage rather than run out...? At any rate, the levels are a snapshot and don't necessarily say much about the flux (rate of production) of ATP...?


