"Facts about COVID-19": Swiss Propaganda Research Article

pamojja

Senior Member
Messages
2,514
Location
Austria
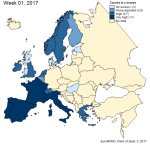
Meanwhile from the monitoring of any excess mortality in Europe for week 14 ending on April 5th:

MAP-2020-14.png


And for comparison again, the worst week during the last 3 years only:

MAP-2017-1.png
 

Hip

Senior Member
Messages
18,185
the very reason I started this thread. I couldn't find.

Did you not see the Imperial College London Report? This was the analysis which changed government policy of US and UK governments, and led to lockdown.


The date of the implementation of lock-down can be compared with each country to see, if 2-3 weeks later due to the lock-down the mortality number goes down. But what till now was found was that the peak was already reached during the lock-down!

Can you provide a reference?


A parameter that indicates the rapidity of pandemic exponential growth is the death doubling time (how long it takes for the number of deaths to double).

If the death doubling time gets longer, then you know the exponential growth is slowing down.

If you look at countries like Italy, their death doubling time before the lockdown was 4 days. Slowly as a result of lockdown, the death doubling time has increased, and you can see on the Italian Worldometers death graph that the death doubling time is currently 13 day, and constantly getting longer. Italy has been in lockdown since 9 March.

I've been observing the death doubling time of several countries placed under lockdown, and each week you see that the death doubling time gets longer.
 

pamojja

Senior Member
Messages
2,514
Location
Austria
pamojja said:
..the very reason I started this thread. I couldn't find.
Did you not see the Imperial College London Report? This was the analysis which changed government policy of US and UK governments, and led to lockdown.

Oh, sadly, yes. But not at all based on sound science.

Imperial College UK COVID-19 numbers don’t seem to add up

A study published two weeks ago by the COVID-19 Response Team from Imperial College (Ferguson20[1]) appears to be largely responsible for driving UK government policy actions. The study is not peer reviewed; indeed, it seems not to have been externally reviewed at all. Moreover, the computer code used to produce the estimates in the study – which on Ferguson’s own admission is old, unverified and documented inadequately, if at all – has still not been published. That, in my view, shows a worrying approach to a matter of vital public concern.

rest at site..
A model from Imperial College London predicted between 250,000 and 500,000 deaths in the UK „from“ Covid-19, but the authors of the study have now conceded that many of these deaths would not be in addition to, but rather part of the normal annual mortality rate, which in the UK is about 600,000 people per year. In other words, excess mortality would remain low.
Neil Ferguson of Imperial College London now assumes that the UK has sufficient capacity in intensive care units to treat Covid19 patients.

But what till now was found was that the peak was already reached during the lock-down!
Can you provide a reference?

The video you refused to see. The abstract with the title leading to all the already analyzed data, you considered not worth to click. Here it is again: https://www.researchgate.net/public...ng_and_implications_for_prevention_strategies

I've been observing the death doubling time of several countries placed under lockdown, and each week you see that the death doubling time gets longer.

Would you be willing to share the date you collected for several countries?
 

Hip

Senior Member
Messages
18,185
But not at all based on sound science.

Do you know of any high quality analyses that rivals this and comes to a different conclusion?


The video you refused to see.

I am not going to watch a long video; please provide a timecode if you would like me to watch a specific bit. But in any case, generally I am not greatly impressed with the views of retired professors, like the one in that video. These guys often no longer have their fingers on the pulse. How about providing a reference from a reputable team at a reputable university?


Would you be willing to share the date you collected for several countries?

It is all there on the Worldometers for each country. For example, go to the Italian Worldometers death graph (the one entitled "Total Coronavirus Deaths in Italy", which is an orange graph).

Run your mouse cursor along the curve, and this will show the total deaths so far for each date.

Go back to before the lockdown started, say 1 March, which you can see shows 41 deaths in Italy. Then if you move forward 3 days to 4 March, you will see the deaths have gone up to 107, which is approximately double. So the death doubling time at that period was around 3 days.

But as you move into the lockdown period, and do the same thing, you can see that the death doubling time gets longer and longer.

Exponential growth is characterized by its doubling time, so when the doubling time gets longer, the growth has slowed down.
 
Last edited:

Wayne

Senior Member
Messages
4,507
Location
Ashland, Oregon
More than 2,200 coronavirus deaths in nursing homes, but federal government isn't tracking them
The numbers are likely a significant undercount, given the limited access to testing and other constraints, state officials and public health experts say.


Snippet:

"NBC News tallied 2,246 deaths associated with long-term care facilities, based on responses from 24 states. This, too, is an undercount; about half of all states said they could not provide data on nursing home deaths, or declined to do so. Some states said they do not track these deaths at all.
Nursing home residents are among those most likely to die from the coronavirus, given their advanced age and the prevalence of other health conditions. But the federal government does not keep a formal tally of the number of coronavirus deaths in nursing homes or the number of facilities with infections, the Centers for Disease Control and Prevention said."
 

pamojja

Senior Member
Messages
2,514
Location
Austria
Do you know of any high quality analyses

Why you ask, when you just before quoted me saying: not finding any would be the reason for this thread? Imperial's College London Report isn't.

..with the views of retired professors, like the one in that video. These guys often no longer have their fingers on the pulse.

A more accurate finger then your source. But I understand by now you never counter arguments, but always resort to questioning the argumenter instead you disagree with. At least in this thread.
 

Hip

Senior Member
Messages
18,185
But I understand by now you never counter arguments, but always resort to questioning the argumenter instead you disagree with.

Like everyone with ME/CFS, I have limited mental capacity, so cannot view or read everything that people post on threads. So sometimes you have to make a quick judgement about whether it is worth spending time. I looked at about 10% of the video, and what he is saying I have heard many times before, that coronavirus is no worse that regular seasonal flu epidemics. Nothing new there.


But how many seasonal flu epidemics do you know which have required the emergency building of large new improvised hospitals to deal with all the sick people with COVID-19?

And remember, if we had not gone into lockdown, the sudden explosion of cases may have left us unable to cope even with the new hospitals.
 
Last edited:

pamojja

Senior Member
Messages
2,514
Location
Austria
I've been observing the death doubling time of several countries placed under lockdown, and each week you see that the death doubling time gets longer.

Thats totally to be expecteed with resperatory infection pandemics year after year as pointed out by Prof. Wittkowski, even without lockdowns (with the exception of 1819 for very obvious other reasons). Looking at this wikipedia chart of daily deaths of the 5 major affected nations:

New_cases_daily_for_Covid-19_in_world_and_top_5_countries_Jan-Mar.png


And for simplicity just looking at the whole world:

Code:
deaths - day
2000 - 9 (Feb. 29.)
4000 - 5 (Mar. 5.)
8000 - 6 (Mar. 11.)
16000 - 5 (Mar. 15.)
32000 - 4 (Mar. 19.)
64000 - 12  (Mar. 31)

It looks as if the peak was reached for the most affected countries together on April 2nd.

Mar. 21 Italy - after 31 days
Mar. 26 Spain - 29 days
Mar. 30 Iran - 40 days (numbers I trust the least)
Apr. 3 France - 39 days
soon USA - 41+ days

Perfectly within the timeframe such pandemics usually slow down. Even if we look here very selectivly only at the worst affected countries. And the vast majority of countries far less affected (ie. with no excess mortality).

But how many seasonal flu epidemics do you know which have required the emergency building of large new hospitals to deal with all the sick people with COVID-19?

I know, you don't particularly like investigative journalism, and probably will again point out not to trust. But I already posted a page ago, and will just quote again:

  • Many clinics in the Europe and the US have been lacking patients and some have had to introduce short-time work. Numerous operations and therapies were cancelled, even emergency patients sometimes stay at home out of fear, which may lead to extra deaths.
  • Several media have been caught trying to dramatize the situation in clinics, sometimes even with manipulative pictures and videos. In general, many media outlets do not question even doubtful official statements and figures.
  • The first Swiss hospitals have to announce short-time work due to the very low capacity utilization: „The staff in all departments has too little to do and has reduced overtime in a first step. Now short-time work is also being registered. The financial consequences are severe.“ As a reminder, a study by ETH Zurich based on largely unrealistic assumptions predicted the first bottlenecks in Swiss clinics by April 2. So far this has not happened anywhere.
  • In Switzerland, there was a pronounced wave of influenza at the beginning of 2017. At that time, there were almost 1500 additional deaths in the over 65-year-old population in the first six weeks of the year. Normally, around 1300 people die in Switzerland every year as a result of pneumonia, 95% of whom are over 65 years old. By comparison, a total of 762 deaths with (not caused by) Covid19 are currently reported in Switzerland.
  • The official US Covid19 projections so far have overestimated hospitalisations by a factor of 8, ICU beds needed by a factor of 6.4, and ventilators needed by a factor of 40.5.
  • The US television station CBS was caught using footage from an Italian intensive care unit in a piece on the current situation in New York. In fact, dozens of recordings by citizen journalists show that it is currently very quiet in the hospitals on the US East and West Coast, described as „war zones“ by the media. Even the „corpse refrigerator trucks“ prominently shown in the media are unused and empty. (Note: Some of these authors may draw unverified conclusions.)
  • Contrary to media reports, the register of German intensive care units also shows no increased occupancy. An employee of a Munich clinic explained that they had been „waiting for weeks for the wave to hit“, but that there was „no increase in patient numbers“. He said that the politicians‘ statements did not correspond with their own experience, and that the „myth of the killer virus“ could „not be confirmed“.
  • Also in Swiss clinics, no increased occupancy has been observed so far. A visitor to the cantonal hospital in Lucerne reports that there is „less activity than in normal times“. Entire floors have been closed for Covid19, but staff „are still waiting for patients“. The hospitals in Bern, Basel, Zug and Zurich have also been „cleaned out“. Even in Ticino, the intensive care units are not working to capacity, but patients are now being transferred to the German-Swiss departments. From a purely medical point of view, this makes little sense.
  • In Spain, 15% of test-positives are doctors and nurses. Although many of them show no symptoms, they have to go into quarantine, causing the Spanish healthcare system to collapse.
  • In Germany, some clinics can no longer accept patients – not because there are too many patients or too few beds, but because the nursing staff have tested positive, although in most cases they hardly show any symptoms. This case illustrates again how and why health care systems are getting paralysed.
  • The British Guardian reported in February 2019 that even in the generally weak flu season 2018/2019 there were more than 2180 flu-related admissions to intensive care units in the UK.
  • An Italian study of August 2019 found that flu deaths in Italy were between 7,000 and 25,000 in recent years. This value is higher than in most other European countries due to the large elderly population in Italy, and much higher than anything attributed to Covid-19 so far.
Those of you who have spent any time debating or discussing the current coronavirus “pandemic” on social media will almost certainly have encountered an argument that goes something like this:

“Coronavirus is nothing like the flu, the seasonal flu doesn’t overwhelm health services like this.”

But is this true? We’ve done some research.

In 2018 hospitals all across the United States were full to capacity with flu patients. Alabama declared a state of emergency. Elective surgeries were cancelled, patients were turned away.

California hospitals were “war zones” where people were treated in hastily erected tents.

The same year ICUs in Milan were “totally overrun” with flu cases.

In December of 2019 the NHS had to implement “emergency temporary beds” in 52% of its hospitals to account for their regular “winter crisis”. Most of those hospitals still had temporary beds operating from the previous winter.

Last November experts were publishing reports warning that the NHS was under too much pressure to deal with the seasonal flu.

The 2009 Swine Flu pandemic turned out to be no worse than a bad flu season in the end, but nevertheless had a huge impact on hospitals across the United States.

...rest at site: https://off-guardian.org/2020/04/02/coronavirus-fact-check-1-flu-doesnt-overwhelm-our-hospitals/

Difference in death rates for flu and coronavirus:

Again so missleading. Because we know the mortality of flu. We can't know the real mortality of covid yet, since really nobody knows at this point how many are affected. Pure speculation based on not at all proven worse-case scenarios again.

Therefore the title of this thread:

Facts about Covid-19
i
- against mere speculations
 
Last edited:

Hip

Senior Member
Messages
18,185
We can't know the real mortality of covid yet, since really nobody knows at this point how many are affected.

As I have said before, we have an accurate picture of the death rate from the Diamond Princess. And from Germany's excellent data.


The only factor I am aware of that might make us question this comparison of flu and coronavirus death rate is the fact that some flu deaths are not actually recorded as a flu, but instead the cause of death may be recorded as whatever underlying health condition the patient had.

For example, if the patient had a weak heart, and they died of flu, the cause of death might be put down as heart disease. I read that in this article. Though I did not find that article very clear, and just how that affects the flu death rate statistics I am not sure, and neither is the author.
 

Hip

Senior Member
Messages
18,185
Thats totally to be expecteed with resperatory infection pandemics year after year as pointed out by Prof. Wittkovski

A flattening out of the curve is expected during epidemics, but only later on in the epidemic. At the early phase it remains an exponential curve.

Epidemics begin by following exponential growth, but as more and more people get infected, the pathogen starts having difficulty finding new hosts to infect, and it is at this point that the growth slows down, and departs from an exponential.

The correct mathematical curve that describes epidemics is actually the sigmoid function. That is what I read. The sigmoid curve looks like this:
320px-Logistic-curve.svg.png


At the beginning of the sigmoid curve (on the far left of the graph), the curve is the same as the exponential curve. But later the sigmoid starts to flatten out, as so departs from an exponential.
 
Last edited:

pamojja

Senior Member
Messages
2,514
Location
Austria
As I have said before, we have an accurate picture of the death rate from the Diamond Princess. And from Germany's excellent data.

And as I and numerous other pointed out to you already, also on other forums, the cruise ship isn't a representative sample. Additionally the PCR test as found in the community of Vo only detects 3% infected at the most, 7-10 days later misses already 90% of those infected again. All already countless times replyed on this thread and elsewhere. You just come with the same weak arguments again and again.

By accident I just saw the live presentation of first results from "Covid-19-Cluster-Study", Streeck and others.
The study is carried out in Ganglet/Heinsberg, an area highly affected in Germany.

So far 509 persons from the half of the sample households have been examined for the study. It took ten days.

acute infected - PCR test - 2%
immunity - antibody test - 14%
case fatality - 0.37%
mortality - 0.06%

So, according to the study so far, 0,37% of the infected people have died, and 0.06% of the population have died (from or with the virus). 14% of the population in Gangelt/Heinsberg have been infected (or still are, respectively), and 2% are indeed acute infected.

The 14% are the lowest estimation from different methods (Streeck didn´t give the other numbers).

You never enter in a meaningful dialog to given counterarguments. But just repeat your arguments from pages ago already answered and then ignored by you, a view pages later of this same thread again and again. Asking repeatedly for sound sources already given. But yourself more than negligent in giving sound sources for your points.

At the beginning (on the far left of the graph), the sigmoid curve is the same as the exponential curve. But later it starts to flatten out.

And how that sigmoid curve is not exactly what was seen till now, including its flattening. In exactly the time to be expected?
 

pamojja

Senior Member
Messages
2,514
Location
Austria
And remember, if we had not gone into lockdown, the sudden explosion of cases may have left us unable to cope even with the new hospitals.

You didn't even look at the presented hard data which showed that in those countries where the peak was already reached long before us, the lockdowns have been implemented at exactly the time of the peak. Which isn't possible in retrospect to take as proof for the lockdown working. Because those infected untill the lockdown will in average still die after about 17 days. And the peak therefore - if the lockdowns really worked - could be reached only in 17 days after the lock-down.

This hard data you so persistently refuse to look at, is actually the proof that lock-downs had a minimal effect, compared to the self-limiting naturally reached peak. As it did year after year since time immorial (again, with some exceptions; but certainly not this case).
 

Hip

Senior Member
Messages
18,185
the cruise ship isn't a representative sample.

The age-adjusted cruise ship death rate quite closely matches the death rate data from Germany. Both Germany and the Diamond Princess cruise ship had rigorous and comprehensive testing, arguably the best testing there has been. And the fact that the figures match tends to inspire confidence in them.

The age-adjusted cruise ship death rate is 0.5%. Ref: here

The German death rate is 0.6%. Ref: here

So these closely match.


And more recently, most of the people in the town of Gangelt in Germany were tested for coronavirus antibodies, and it was found that 15% had been infected. This allowed them to calculate a death rate of around 0.4%. Ref: here

So all these high quality measurements of death rate closely tally, so I think we can be reasonably certain that the death rate is around 0.5%.


And how that sigmoid curve is not exactly what was seen till now, including its flattening. In exactly the time to be expected?

We are still in the relatively early stage of the pandemic. In Gangelt in Germany, the population was recently checked via antibody testing, and 15% were found to have been infected with coronavirus. So we are still on an early point on the curve, where the growth is still more-or-less exponential. When we reach about 50% infected, that's when you start to see some natural flattening of the curve.

Thus I think the slowdown in growth is likely due to the lockdowns, and not because we are reaching the later stages of the pandemic.


It looks as if the peak was reached for the most affected countries together on April 2nd.

That graph you posted above in this post, where does it come from? And what is represented on the vertical axis?
 
Last edited:

pattismith

Senior Member
Messages
3,988
You didn't even look at the presented hard data which showed that in those countries where the peak was already reached long before us, the lockdowns have been implemented at exactly the time of the peak. Which isn't possible in retrospect to take as proof for the lockdown working. Because those infected untill the lockdown will in average still die after about 17 days. And the peak therefore - if the lockdowns really worked - could be reached only in 17 days after the lock-down.

This hard data you so persistently refuse to look at, is actually the proof that lock-downs had a minimal effect, compared to the self-limiting naturally reached peak. As it did year after year since time immorial (again, with some exceptions; but certainly not this case).
You are wrong.

-The natural sigmoid curve would be much longer to flatten without the lockdown, and will rise much much higher, with many many many more deaths to happen. We actually don't know exactly how long would last a natural curve and how much deaths it would cost.

-The 17 days rule doesn't makes sense to me for several reasons.
Typical People getting infected just at the lockdown time will be ill about 10 days later, then will start worsen 7 days later, put on respirator and then will die 1 week later (24 days in toto after they got infected). Very old people in senior home mostly didn't reach any hospital and die very very quickly. So you have two different populations with very different delayed death time.
Infection is still spreading in families and in senior homes after the lockdown because family members can't isolate one from another after the lockdown, and senior people are infected by the senior home workers (no mask and no test for them in France).
In France, the curve is flattening (the total deaths curve is no longer exponential after about 3 weeks of lockdown = the daily deaths number has stabilized), and we have currently about as many deaths in Hospital as in senior homes each day.

-The number of new patients put on respirator may be a better tool to see the effect of the lockdown. Here in France it started to diminish significantly on 1th of April, 2 weeks after the lockdown. 2 weeks delay fit quite well with people getting infected just before the lockdown.
1586576085539.png
 
Back