undiagnosed
Senior Member
- Messages
- 246
- Location
- United States
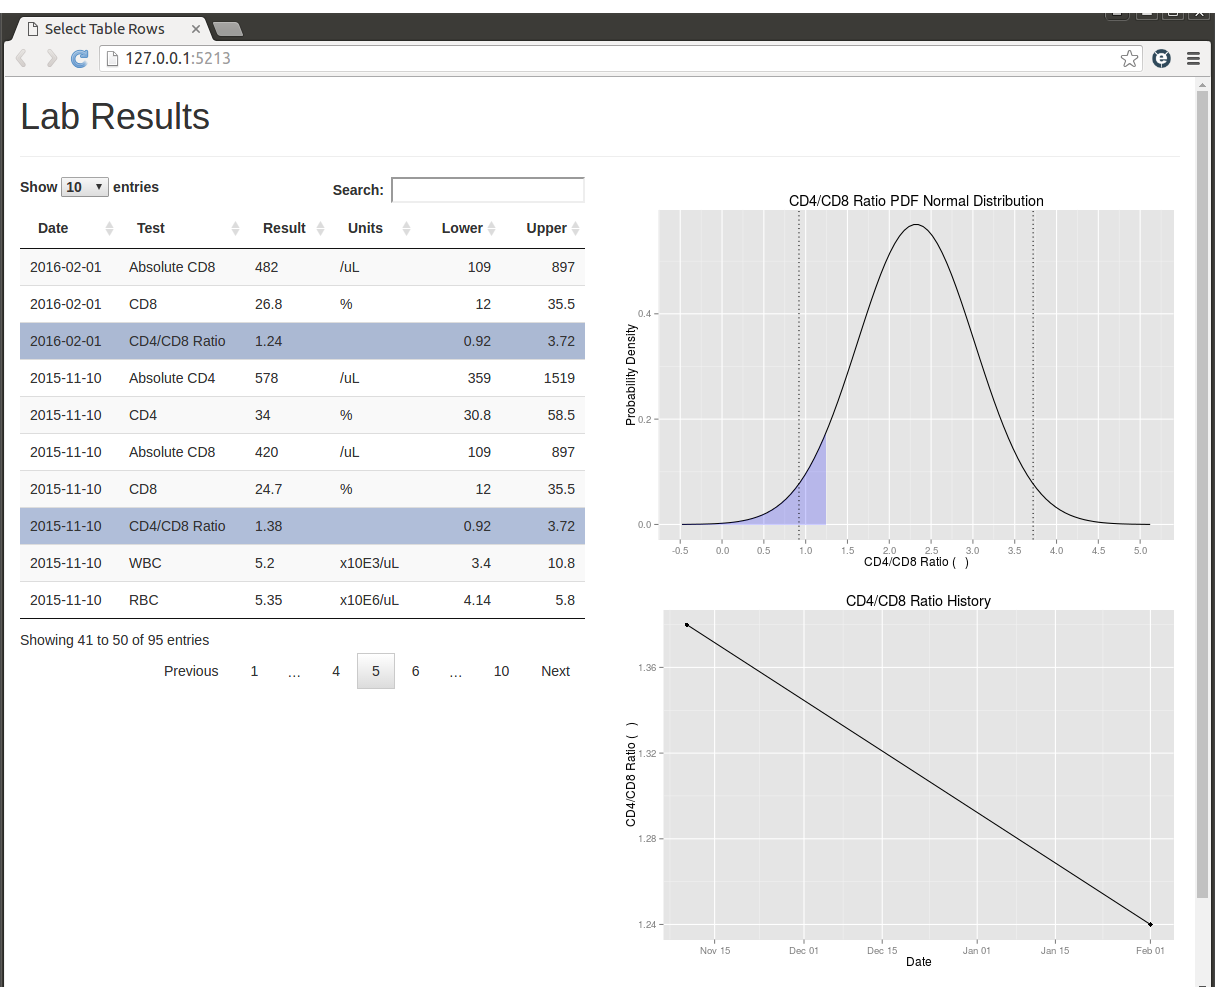
I am working on a prototype lab result viewer that utilizes the previously described reference range visualizer. It also has a history plot to see past values. The image below shows an example. The selected values are used to generate the plots. If anyone else would be interested in tracking their lab results with this, I can look into developing an editor.