This is likely to be a minority interest. It relates to the SF-36 questionnaire; this is used a lot in ME/CFS research so I think a few people e.g. those who have been interested in discussing various PACE Trial papers, may find it of interest.
However, I don't intend to write a big summary.
However, I don't intend to write a big summary.
Comparison of methods for the scoring and statistical analysis of SF-36 health profile and summary measures: summary of results from the Medical Outcomes Study.
Med Care. 1995 Apr;33(4 Suppl):AS264-79.
Ware JE Jr, Kosinski M, Bayliss MS, McHorney CA, Rogers WH, Raczek A.
Source
Health Institute, New England Medical Center, Boston, MA, USA.
Abstract
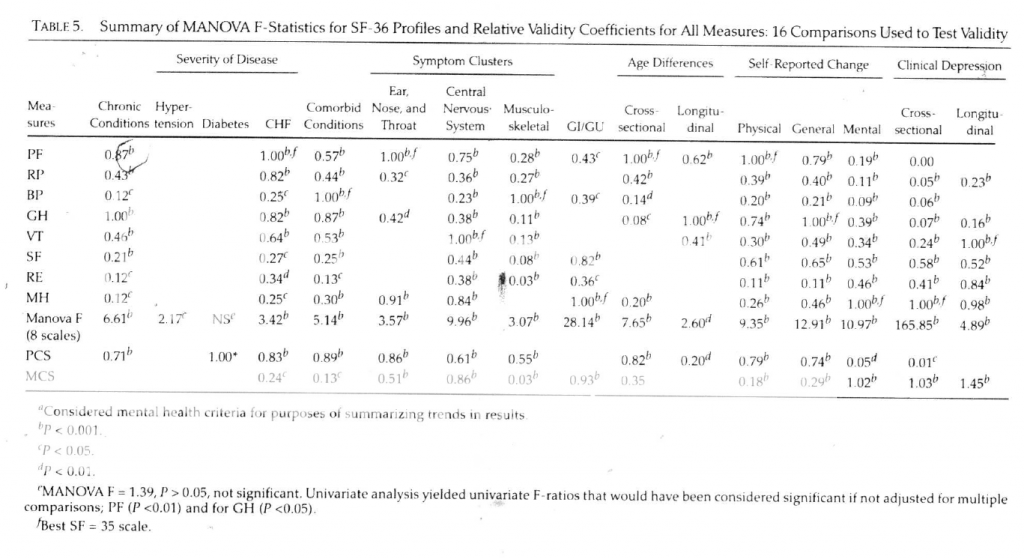
Physical component summary (PCS) and mental component summary (MCS) measures make it possible to reduce the number of statistical comparisons and thereby the role of chance in testing hypotheses about health outcomes.
To test their usefulness relative to a profile of eight scores, results were compared across 16 tests involving patients (N = 1,440) participating in the Medical Outcomes Study.
Comparisons were made between groups known to differ at a point in time or to change over time in terms of age, diagnosis, severity of disease, comorbid conditions, acute symptoms, self-reported changes in health, and recovery from clinical depression.
The relative validity (RV) of each measure was estimated by a comparison of statistical results with those for the best scales in the same tests.
Differences in RV among scales from the Medical Outcomes Study 36-Item Short-Form Health Survey (SF-36) were consistent with those in previous studies.
One or both of the summary measures were significant for 14 of 15 differences detected in multivariate analyses of profiles and detected differences missed by the profile in one test.
Relative validity coefficients ranged from .20 to .94 (median, .79) for PCS in tests involving physical criteria and from .93 to 1.45 (median, 1.02) for MCS in tests involving mental criteria.
The MCS was superior to the best SF-36 scale in three of four tests involving mental health.
Results suggest that the two summary measures may be useful in most studies and that their empiric validity, relative to the best SF-36 scale, will depend on the application.
Surveys offering the option of analyzing both a profile and psychometrically based summary measures have an advantage over those that do not.
PMID: 7723455 [PubMed - indexed for MEDLINE]