If the house is built on quicksand it will sink. This also applies to the PACE trials. There is selection bias by making use of the Oxford criteria. These criteria are equal to (chronic) fatigue in general. Add that to all the methodological misconceptions. There can be only one conclusion: retraction of the publication in the Lancet. These authors are real clowns. They deserve a clown award!

-

Welcome to Phoenix Rising!
Created in 2008, Phoenix Rising is the largest and oldest forum dedicated to furthering the understanding of, and finding treatments for, complex chronic illnesses such as chronic fatigue syndrome (ME/CFS), fibromyalgia, long COVID, postural orthostatic tachycardia syndrome (POTS), mast cell activation syndrome (MCAS), and allied diseases.
To become a member, simply click the Register button at the top right.
You are using an out of date browser. It may not display this or other websites correctly.
You should upgrade or use an alternative browser.
You should upgrade or use an alternative browser.
PACE Trial follow-up: Here's the table looking at the effects of having CBT or GET after 52 weeks
- Thread starter Dolphin
- Start date
Fair point.On scale, I like the space as it gives some sense that this ain't a big change.
First version is excellent (apart from clincially). Second works too. Your call from here on.

Anna Wood
wood/sheridan
- Messages
- 487
Nice one!
SOC
Senior Member
- Messages
- 7,849
I like the second one, too.If you have a preference between the two graphs, please say so. Otherwise I'll probably go with the second version (CUD on line)
Simon
Senior Member
- Messages
- 3,789
- Location
- Monmouth, UK
Hmm, ended up more complex than I'd hoped, but now tweeted:

Thought it would be useful to include comments from @Tom Kindlon who was so helpful in shaping this graph
Thought it would be useful to include comments from @Tom Kindlon who was so helpful in shaping this graph
Tom Kindlon said:LISTSERV 16.0 - CO-CURE Archives
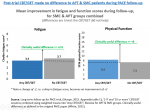
I previously highlighted that there is data in the Sharpe et al. (2015) appendix that examines the effects of participants doing extra CBT or GET after doing APT or SMC-alone in the trial.
------
Simon (McGrath) made some summary graphs of the information which collapses into this graph (Also on Twitter:and OneDrive:
----
As one can see, those who did no CBT/GET after doing APT or SMC-alone had numerically slightly better improvements in fatigue than those who actually did CBT/GET while those who did CBT or GET after doing APT or SMC-alone had numerically slightly better (self-reported) physical functioning than those who didn't do any CBT/GET.
However, both differences were tiny: only a small fraction of a clinically useful difference.
Basically there isn't evidence for the PACE Trial authors' claim that the reason the APT and SMC-alone groups caught up with the CBT and GET groups was because they did CBT or GET after 12 months. I think this should be highlighted in lots of places. The reporting of the trial has been very misleading and it stems from what the PACE Trial authors claimed.
For three out of the four measures, for those who went on to get CBT or GET, the improvements are bigger for the 1-9 session group compared to the 10 or more session group so it isn't due to patients getting insufficient CBT or GET.
Tom
Attachments
Last edited:
Cheshire
Senior Member
- Messages
- 1,129
What's the difference between "any CBT/GET" and "no CBT/GET"?
Simon
Senior Member
- Messages
- 3,789
- Location
- Monmouth, UK
New! Improved! (Bit simpler)
This really is my last word on things, you'll be relieved to hear.

This really is my last word on things, you'll be relieved to hear.
Last edited:
Snow Leopard
Hibernating
- Messages
- 5,902
- Location
- South Australia
View attachment 13417 New version! Hopefully a bit clearer. Thanks @Simon for suggested changes
Showing the ranges definitely puts things into context and I prefer this sort of graph than the ones Simon has been making (sorry Simon, but...).
I can't guess what the squares and diamonds are supposed to represent, but... Looking at the graph, I can't see any meaningful difference between them anyway.
Simon
Senior Member
- Messages
- 3,789
- Location
- Monmouth, UK
The data are for patients who were assigned to SMC alone, or APT (pseudo-pacing) in the PACE trial. When the trial ended after one year, about half went on to have CBT or GET, who are the "Any CBT/GET" group in the graph (includes those who had the 'full dose' ten or more CBT/GET sessions, or fewer sessions [who ironically did better]). The No CBT/GET group never had any CBT or GET during the whole period, including follow-up (a total of 2.5 years, on average).What's the difference between "any CBT/GET" and "no CBT/GET"?
Thanks. I did tweet to James Coyne, Keith Laws and even Simon Wessely, but no response so far.@Simon upload this somewhere and tweet it to Coyne. We need to get this out into the media, and I think Coyne could really use a graphic like this at the moment.
No problem - different strokes for different folks! I like Anna's graph too, but it's a more sophisticated (and elegant) analysis that I don't think will be readily understood by a wider audience - who were a main target for me.I prefer this sort of graph than the ones Simon has been making (sorry Simon, but...).
Ellkaye
Senior Member
- Messages
- 163
Oxford 1994 criteria,period.
That is not ME.
Withdraw Pace now.
A lot has happened in 21 years.
Since 2009 even.
That is not ME.
Withdraw Pace now.
A lot has happened in 21 years.
Since 2009 even.
- Messages
- 86
- Location
- East of England
Thanks @Anna Wood. I really like this. It's really obvious how little change there is between no CBT / GET and any number of sessions of CBT / GET.View attachment 13417 New version! Hopefully a bit clearer. Thanks @Simon for suggested changes
Can I just clarify a couple of things?
Sorry if this is a daft question but are these the scores from the beginning of the trial to 2.5 years later, or from the end of the trial to 2.5 years later?
Are the markers that look like arrows going up and down just the two symbols very close together?
What is the significance of the diamond and squares? Is it the top and bottom of the range, and what is the reason for the fact that sometimes the diamond is at the top and sometimes the square on the CFQ scores?
Ellkaye
Senior Member
- Messages
- 163
I just love the sound of this question !!!!!!!!
Fantastic !!!!!
Throw in some spades hearts and jacks queens n kings !!!!!
Fantastic !!!!!
Throw in some spades hearts and jacks queens n kings !!!!!
Anna Wood
wood/sheridan
- Messages
- 487
Sorry if this is a daft question but are these the scores from the beginning of the trial to 2.5 years later, or from the end of the trial to 2.5 years later?
Are the markers that look like arrows going up and down just the two symbols very close together?
What is the significance of the diamond and squares? Is it the top and bottom of the range, and what is the reason for the fact that sometimes the diamond is at the top and sometimes the square on the CFQ scores?
Sure. So all this data is the score at 2.5 years. Some people (those in the APT/SMC groups) had no sessions of CBT, some in the APT/SMC added a few sessions of CBT, so in total they had either 1-9 sessions or 10 sessions. People in the CBT/GEt groups had 15 sessions through the trial. Some had no more sessions (so 15 in total), some had a few more (so 1-9 +15 =16-24, or 10+15=25)
So to answer your second question In the first half of the graph only: the diamonds are people assigned to the APT arm and the squares are SMC arm. In the second half of the graph only: diamond is people assigned to the GET arm and squares are CBT arm.
I realise this isn't quite clear. I could add a legend but I think it will get a bit cluttered. Or I could average the two points (perhaps weighted by the number of people in each group). Thoughts?
(And yes, if they overlap, they look funny! They vary because, CBT/GET has no real effect
)Something like this might help clarify it:So to answer your second question In the first half of the graph only: the diamonds are people assigned to the APT arm and the squares are SMC arm. In the second half of the graph only: diamond is people assigned to the GET arm and squares are CBT arm.