• Welcome to Phoenix Rising!

    Created in 2008, Phoenix Rising is the largest and oldest forum dedicated to furthering the understanding of, and finding treatments for, complex chronic illnesses such as chronic fatigue syndrome (ME/CFS), fibromyalgia, long COVID, postural orthostatic tachycardia syndrome (POTS), mast cell activation syndrome (MCAS), and allied diseases.

    To become a member, simply click the Register button at the top right.

CFS/ME starts most often age 10-19 & 30-39: Norwegian population study

Simon

Senior Member
Messages
3,789
Location
Monmouth, UK
@Jonathan Edwards @taniaaust1 @Woolie @alex3619 continuing the discussion started here, as this thread seems more relevant
I know lots of stuff suggests the younger you are, the better your prognosis, and that could well be true. But there's another possiblility: it could be if you're younger, the onset of your CFS is more likely to be acute EBV. And it could be that EBV-onset has a slightly better prognosis.

That's a really interesting observation!

It ties in with the idea of an early 'mono/EBV' peak, and a separate, later adult peak, quite possibly with very different causes:
Two age peaks in the incidence of chronic fatigue syndrome/myalgic encephalomyelitis: a population-based registry study from Norway 2008¿20127

Figure One: twin age peaks:


(this image may be copyright: it's from the linked open source paper above, but please don't reproduce without linking to the original paper and explaining it may be copyright).

I haven't seen anything that says what proportion of adolescents with mecfs had it post mon/EBV, but get the impression it's most of them.

The incidence graph in brown and blue seems to me to tell us more than almost everything else we know about ME/CFS. Epidemiology generally doesn't lie and it forces constraints on any hypothesis right at the start.

My initial reactions are that:
1. There are obviously two diseases. This is not a wobble.
2. The first disease does NOT look like EBV, it starts too early.
3. The first disease does not fit either with the 'high achiever crash/yuppie flu' concept, which ought to be more 18-28.
4. The second disease is NOT a typical autoimmune disease because it tails off by 60. A purely B cell stochastic process should go on getting commoner with age until you start to exhaust the susceptible genetic pool (which happens for RA and breast cancer only around 85). The only autoimmune disease that has this sort of curve is lupus.
5. The first disease could be a T cell disease such as type I diabetes or an adolescent immune disease like anti-DEK+ve oligoarthritis (one of the common childhood arthropathies).
6. The early curves for boys and girls look more or less identical to what Esther Crawley reports, which gives reassurance that this is bona fide and not skewed by some local cultural factor.
7. This is why we need more population based studies! And what we need is to have a population for which curves can be constructed for known T and B cell diseases, EBV, reactive affective disorders (i.e. depression, phobias etc.) and anything else relevant.
Does the age curve not reflect wpmen caring for infeced schoolchildren?
It might be two diseases, I have favoured that idea for some time. However it could also be two pathways to the same end state, perhaps with two different risk factor profiles, including hormonal changes.

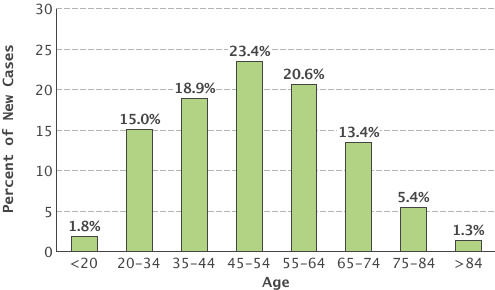
Some more about how this data was collected, as it's fascinating but far from bullletproof. It comses from the vast Norwegian national health database, looking at new 'cfs' cases diagnosed from 2008-2012
For each hospitalization or outpatient visit, reporting of data to the NPR is mandatory and is linked to the reimbursement system...

Cases of CFS/ME were all in- and outpatients in Norwegian hospitals who were registered with the ICD-10 code G93.3 (‘postviral fatigue syndrome/benign myalgic encephalomyelitis’). Data from mental health care facilities were not included.
So note a) doesn't include primary care (maybe all cases get referred on too specialist centres? I don't know); b) a diagnosis is mandatory for doctors to get paid, they might not be thinking too hard about it, and different doctors may diagnose differently - there were no agreed case definitions used.

Even so, 5,800 new cases, of which 1,380 were in the 10-19 age group.

more later.
 

daisybell

Senior Member
Messages
1,613
Location
New Zealand
I'm interested in what @Jonathan Edwards says about this not looking like a typical autoimmune process because of the shape of the graph... I've been trying to find a good comparison graph for MS, and came across this one..
image.jpg
Which looks similar to me!
 

NK17

Senior Member
Messages
592
I'm interested in what @Jonathan Edwards says about this not looking like a typical autoimmune process because of the shape of the graph... I've been trying to find a good comparison graph for MS, and came across this one..
View attachment 9738
Which looks similar to me!
Very interesting graph @daisybell, is it from the robust epidemiological study of Alberto Ascherio et al. from Harvard?

Dr. Ascherio has been one of the researcher in the MS epidemolgical field to clearly show the connection between EBV and MS (simplified concept by me ;) and he is involved in the CFI Chronic Fatigue Initiative here in the US as well.

@Jonathan Edwards are you familiar with Dr. Ascherio's research? I'd love to hear what you think about it.

I still think that there are unexplored epidemological corners in the ME research field and some commonalities with MS.
 

Jonathan Edwards

"Gibberish"
Messages
5,256
I'm interested in what @Jonathan Edwards says about this not looking like a typical autoimmune process because of the shape of the graph... I've been trying to find a good comparison graph for MS, and came across this one..
View attachment 9738
Which looks similar to me!

Absolutely similar! Or near enough. Very interesting. Actually I do not class MS as a typical autoimmune process because there is no solid evidence of autoantibodies - just antibodies in funny places. That is me being narrow minded but it relates to the epidemiological argument in relation to the mechanisms of autoantibody production. MS responds to rituximab so we could go with the second peak being something similar for CFS - a 'wrong context antibody disease' if not strictly an autoimmune disease. And there may be examples with real autoantibodies - I don't know the curves as well for thyroid disease as for the rheumatic ones for instance. But maybe it raises the issue of a bit more environmental emphasis than for instance RA.

It's also sort of intriguing that the MS curve is not smooth on the upstroke - it is relatively crude and could be hiding an early peak just like the CFS histogram.
 

Jonathan Edwards

"Gibberish"
Messages
5,256
Sorry, should have stated the source...
http://www.scielo.br/scielo.php?pid=S0004-282X2006000500005&script=sci_arttext
The graph comes from a study done in Brazil! Perhaps I should look for more....

Yes it would be nice to see something a bit finer grained and there probably is one somewhere. This is where there is so much of a gold mine in population studies. If we had MS data alongside the CFS data from the Norway cohort it would be so interesting to compare the shapes.

I think there have been a lot of good points about potential skewing factors but I like the feel of this histogram. Also Norwegians are very thorough chaps (they actually spend THREE TIMES as much on healthcare per person as we do in the UK!!!!). If this was a paediatric practice artefact I would expect to see a sudden cliff effect at 16 or 18 I think. Not saying there isn't noise but unlike most research I doubt there is motivated bias here!
 

A.B.

Senior Member
Messages
3,780
The Norwegian Directorate of Health has stated that ICD-10 code G93.3 is to be used for this disorder 2]. However, cases in the present study come from a large number of different hospitals and the criteria used to diagnose CFS/ME might have varied. In a recent study, most Norwegian hospitals reported that they had used either the Canadian 2003 criteria 18] or the CDC 1994 criteria 4] when diagnosing CFS/ME in adults 19]. Pediatricians generally reported they follow the guidelines of the Norwegian Pediatric Association 20], which formally refer to the CDC 1994 criteria, but also recommend using a practical, clinical definition of CFS/ME in children with otherwise unexplained severe fatigue of more than three months duration. We cannot exclude the possibility that the relatively high incidence in children and adolescents may be partly due to the use of a less strict case definition of CFS/ME in young people. However, we find it unlikely that this potential over-reporting is substantial, as pediatricians probably are restrictive in using this diagnosis.

The two peaks could theoretically be the result of two different diagnostic criteria being used.

Reference #19 might give a better idea but I'm too tired to read it at the moment.
 

Jonathan Edwards

"Gibberish"
Messages
5,256
The two peaks could theoretically be the result of two different diagnostic criteria being used.

Reference #19 might give a better idea but I'm too tired to read it at the moment.

I think you would just see a dislocation in the curve between paediatrics and adult care then. It might effect the relative bulge sizes but I doubt it would give you this shape.
 

Bob

Senior Member
Messages
16,455
Location
England (south coast)
Some more comparisons, after a very quick search... Some have single peaks, and some have double peaks... There are a couple of similar patterns to ME/CFS... But this isn't an exhaustive list... It was a quick search.

I've included some conditions that are clearly not auto-immune (e.g. dengue fever), just for comparison.

Schizophrenia has a similar (double-peak) pattern to CFS (for both males and females), but with a higher rate for males in early life, and the peaks are at slightly different ages to CFS.

Lyme disease has a remarkably similar double-peak pattern to CFS... Strange coincidence? (But with a higher rate of incidence for males than females, and both peaks are at slightly different ages to CFS.) Could the peaks be related to the ages at which people are most likely to be walking/frolicking in fields? i.e. children and middle age adults?

I couldn't find thyroid disease, but there is a graph for hyperparathyroidism. (With a single peak.)

Dengue fever (I think these may be stats for US citizens) has a single peak in mid-life... Perhaps that indicates the age at which people travel abroad most often?


Schizophrenia

szage.onset.gif


Data Source:
http://www.ncbi.nlm.nih.gov/entrez/...ed&dopt=Abstract&list_uids=8178665&query_hl=1
Image:
http://schizophrenia.com/photos/szage.onset.gif


Lyme disease

Confirmed Lyme disease cases by age and sex--United States, 2001-2010


agesex_700pxW.gif


Data:
http://www.cdc.gov/lyme/stats/chartstables/incidencebyagesex.html
Image:
http://www.cdc.gov/lyme/images/statstables/agesex_700pxW.gif


Huntingdon's Disease.

8565970_f260.jpg


Data source unknown. Possible source:
Myers, Richard H. “Huntington's disease genetics.” NeuroRx 1.2 (2004): 255-262.

Image:
http://s1.hubimg.com/u/8565970_f260.jpg


Hyperparathyroidism

parathyroid-age15,000.gif


Source:
http://parathyroid.com/age.htm
Image:
http://parathyroid.com/images/parathyroid-age15,000.gif


Dengue Fever

figures%5Cm5953a1f15.gif


Data source:
http://www.cdc.gov/mmwr/preview/mmwrhtml/mm5953a1.htm
Image:
http://www.cdc.gov/mmwr/preview/mmwrhtml/figures\m5953a1f15.gif


Cancer of the thyroid.

Age_Dist_New_Cases_Site_076_Sex_0.png


Data:
http://seer.cancer.gov/statfacts/html/thyro.html
Image:
http://seer.cancer.gov/statfacts/html/images/age_distribution/Age_Dist_New_Cases_Site_076_Sex_0.png
 
Last edited:

Woolie

Senior Member
Messages
3,263
I'm interested in what @Jonathan Edwards says about this not looking like a typical autoimmune process because of the shape of the graph... I've been trying to find a good comparison graph for MS, and came across this one..
As I understand it, patients diagnosed with MS sometimes have complaints for many years prior to their formal diagnosis (visual disturbance, chronic fatiue, dizzy spells, etc), so the actual onset of the disease process may be considerably earlier than this type of figure indicates.

I'm also concerned here with the more general issue of what factors lead different clinicians to diagnose CFS, and how this might contaminate age of onset curves. It may be the case that the CFS diagnosis is more readily given for certain age groups than others.

I don't think I'm the only one on this board who went to extraordinary lengths to obtain a diagnosis in the first place (it took three years). This in itself tells us that there are many idiosyncratic factors determining who gets diagnosed and who doesn't.

Perhaps these age of onset graphs tell us more about diagnosing practices than actual CFS onset?
 

daisybell

Senior Member
Messages
1,613
Location
New Zealand
But... If there really are two spikes, why??? What factors could account for the increased likelihood of developing ME in those two age bands? Can we learn anything from the MS data? It seems to me that the two diseases share at least some crucial factors. Antibodies are involved (probably) although neither looks truly autoimmune, women are at greater risk, the age of onset is broadly similar and not well explained, relapsing and remitting course is common... Etc etc
Has there been any work done on familial incidence of MS for people with ME or vice versa?
 

Sing

Senior Member
Messages
1,782
Location
New England
A note about thyroid malignancy:

Dr. Byron Hyde of Ottawa, www.nightingale.ca , who has been diagnosing and studying ME patients since the 1980's, has found a far higher rate of thyroid cancer. While the normal rate of thyroid malignancy is 1-15 cases per 100,000, he has found a rate of 6,000 per 100,000 for ME patients.
 

Seven7

Seven
Messages
3,444
Location
USA
well CFS soubgroup low NK = Low NK cells
=> which leads to cancers.

If one of the prevalances of CFS is low NK cell or activity then just google low NK cell and cancer and you will see why.

So it makes sense.
 

Woolie

Senior Member
Messages
3,263
But... If there really are two spikes, why???
Good point. I didn't really present a plausible scenario. But one that occurred to me was that people over 30 might be more assertive in their search for a diagnosis. So older patients - and very young patients still receiving considerable support from their parents - might be more likely to persevere.

Okay, its a stretch.

Curiously, I was 25 at onset. Right in the age-group slump. I think it was particularly hard for me to get a diagnosis, because I got lumped into the "young woman, overacheiver, probable stress/emotional problems" category. I also got asked a lot about how things were going with my boyfriend.
 

Jonathan Edwards

"Gibberish"
Messages
5,256
All very interesting Bob - nice shapes. It shows how complicated it all is. I wonder if the Lyme curve reflects the ages when yo are most likely to be ill enough with Lyme to get a diagnosis - for a reason related to the risk of getting ME bad enough to get diagnosed. I don't think I buy the idea that the second Lyme peak is for the camping holidays with the kids in the first Lyme peak, its a bit too late?
 

Sasha

Fine, thank you
Messages
17,863
Location
UK
A note about thyroid malignancy:

Dr. Byron Hyde of Ottawa, www.nightingale.ca , who has been diagnosing and studying ME patients since the 1980's, has found a far higher rate of thyroid cancer. While the normal rate of thyroid malignancy is 1-15 cases per 100,000, he has found a rate of 6,000 per 100,000 for ME patients.

That's a huge and shocking finding. Has he published it?