
This week I applied an old technique to microbiome analysis which I remember using to solve some messy problems that I was dealing with professionally back in 1982. The solution was to return to the question or assumption without going down the path mostly travelled.
Almost all of the microbiome analysis studies that I have read contains wording such as shown below. The study focused on ratios of bacteria and not relative distribution patterns of bacteria.
In the non-microbiome world
Suppose the question is whether there is wage disparity between Canadians and Australians working in Silicon Valley. The classic test is to find the average wage of each and see if there are significantly different. This is the approach done in microbiome studies.
Instead, a clever data scientist decides to get the actual wage from everyone and then divide the wages into the lowest quarter (25%), low quarter (25%), high quarter(25%) and top quarter (25 %). You would expect the number of Canadians and Australians to be roughly equal in each — but it is possible (with the same average) for them to be very different, for example:
The ability for the common person to see the issue
Below is an example for a mixture of conditions.
When I applied it to this problem, I was literally blown away with the massive number of associations exposed.
See this page for more information on doing this.
A Massive list of relationships
If you go to the full listing of relationships – relationships discovered when you combine multiple symptoms, you will find some 15000 items have been discovered. Fortunately, I have ordered the list in alphabetical sequence to make it easier to view. Click here to go to this page.
All of the above are sleep related, but sleep is not connected to a single bacteria. Sleep issues are likely a side-effect of the other symptoms.
The thing that I really like is the ability to click on any symptom combination and see the actual numbers.
Correcting the Microbiome
This actually gives us, in theory, a much more targeted approach. Using the microbiome and the symptoms, we can infer which bacteria are needing to be increase or decrease. We are no longer talking about high values and low values, but correcting minor shifts.
If you have the symptoms for ‘Bacteria Distribution Example’ above, and we have your microbiome, we can ask the question: Are you in Quantile3 for Flavonifractor? If so, we want to change it. We can go up or down, well, downwards has a greater difference from the expected — so we should go in that direction. KEY CONCEPT: You may not be actually in the high group for
Flavonifractor, your values indicate that this was more likely an upward shift.
This becomes a very nuisance adjustment of the microbiome.
New Suggestion Page in the works
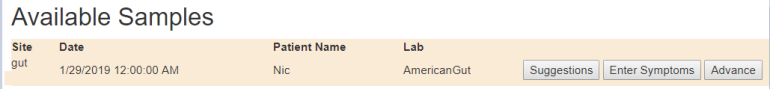
This may take me a few days to code up and test. To use it, you will need to upload your microbiome AND also enter your symptoms/characteristics when the microbiome was taken. Both are essential for the new suggestions page in the works.
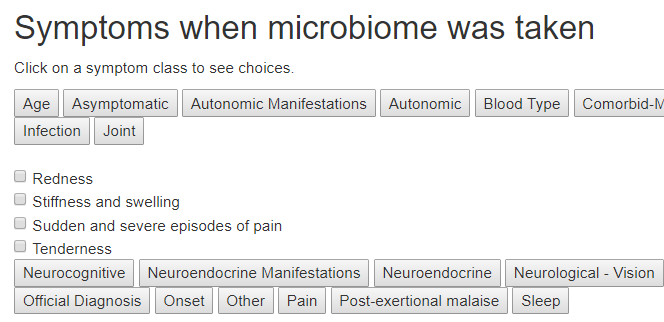
I have revised the site finding where to enter symptoms is clearer.
and made the symptom page easier to use.
Almost all of the microbiome analysis studies that I have read contains wording such as shown below. The study focused on ratios of bacteria and not relative distribution patterns of bacteria.
demonstrated that the dysbiosis could be characterized as directed alteration of the microbiome composition leading to greater disparity between relative abundance of two phyla, Bacteroidetes (Z = 4.77, q = 1.59 × 10) and Firmicutes (Z = -3.87, q = 5.83 × 10).
Characteristic dysbiosis of gut microbiota of Chinese patients with diarrhea-predominant irritable bowel syndrome by an insight into the pan-microbiome.[2019]
I will jump into the real world to explain a bit how we do this.Characteristic dysbiosis of gut microbiota of Chinese patients with diarrhea-predominant irritable bowel syndrome by an insight into the pan-microbiome.[2019]
In the non-microbiome world
Suppose the question is whether there is wage disparity between Canadians and Australians working in Silicon Valley. The classic test is to find the average wage of each and see if there are significantly different. This is the approach done in microbiome studies.
Instead, a clever data scientist decides to get the actual wage from everyone and then divide the wages into the lowest quarter (25%), low quarter (25%), high quarter(25%) and top quarter (25 %). You would expect the number of Canadians and Australians to be roughly equal in each — but it is possible (with the same average) for them to be very different, for example:
- 0-25%: Australian 40, Canadians 60
- 25-50%: Australian 90, Canadians 10
- 50-75%: Australians 30, Canadians 70
- 75% up: Australian 40, Canadians 60
The ability for the common person to see the issue
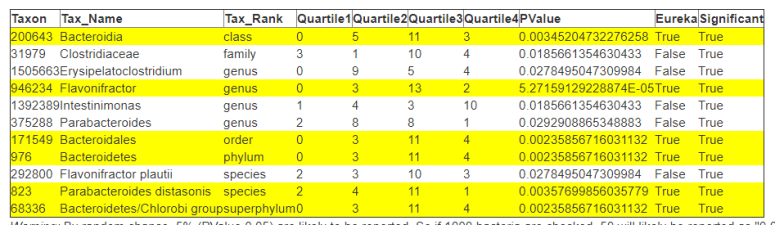
Below is an example for a mixture of conditions.
Bacteria Distribution Example
We see shifts towards higher values, but not the highest range. The expected amount in each quantile is between 4 and 5 (add the numbers and divide by 4). We see the highest values are often close to expected values, the dysfunction is an upward shift, but not a clear overgrowth. Looking only for overgrowths or undergrowths is why the patterns were not seen by researchers.When I applied it to this problem, I was literally blown away with the massive number of associations exposed.
See this page for more information on doing this.
A Massive list of relationships
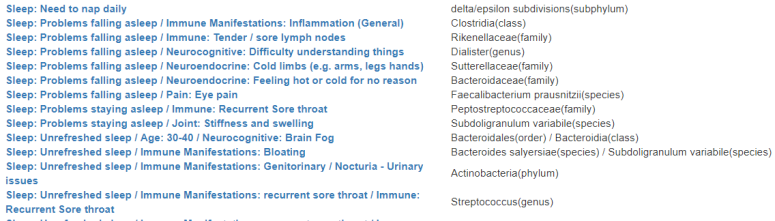
If you go to the full listing of relationships – relationships discovered when you combine multiple symptoms, you will find some 15000 items have been discovered. Fortunately, I have ordered the list in alphabetical sequence to make it easier to view. Click here to go to this page.
All of the above are sleep related, but sleep is not connected to a single bacteria. Sleep issues are likely a side-effect of the other symptoms.
The thing that I really like is the ability to click on any symptom combination and see the actual numbers.
Correcting the Microbiome
This actually gives us, in theory, a much more targeted approach. Using the microbiome and the symptoms, we can infer which bacteria are needing to be increase or decrease. We are no longer talking about high values and low values, but correcting minor shifts.
If you have the symptoms for ‘Bacteria Distribution Example’ above, and we have your microbiome, we can ask the question: Are you in Quantile3 for Flavonifractor? If so, we want to change it. We can go up or down, well, downwards has a greater difference from the expected — so we should go in that direction. KEY CONCEPT: You may not be actually in the high group for
Flavonifractor, your values indicate that this was more likely an upward shift.
This becomes a very nuisance adjustment of the microbiome.
New Suggestion Page in the works
This may take me a few days to code up and test. To use it, you will need to upload your microbiome AND also enter your symptoms/characteristics when the microbiome was taken. Both are essential for the new suggestions page in the works.
I have revised the site finding where to enter symptoms is clearer.
and made the symptom page easier to use.
