Wessely studies from the 90s that keep cropping up

oceanblue

Guest
Messages
1,383
Location
UK
Normally we comment on recent research but there were a series of papers from Simon Wessely and colleagues that are still cited and have become quite influential, so I thought they should have their own thread. Some have already been discussed in part on other threads. The papers seem to come out of a single large study done in the early 1990s:

Population based study of fatigue and psychological distress, 1994
T. Pawlikowska, T. Chalder, S. R. Hirsch, P. Wallace, D. J. Wright, and S. C. Wessely
The ultimate source of the normative fatigue data used in the PACE trial, and source of the graph linking psychological morbidity to fatigue

Postinfectious fatigue: prospective cohort study in primary care, 1995 (pdf), 1995, Wessely S, Chalder T, Hirsch S, Pawlikowska T, Wallace P, Wright DJ.
Basis for claim there is no link between common viral infectons and CFS


Psychological symptoms, somatic symptoms, and psychiatric disorder in chronic fatigue and chronic fatigue syndrome: a prospective study in the primary care setting, 1996 (pdf).
S Wessely, T Chalder, S Hirsch, P Wallace and D Wright
Source of a graph linking number of CDC symptoms to psychological morbidity.

The prevalence and morbidity of chronic fatigue and chronic fatigue syndrome: a prospective primary care study. 1997. S Wessely, T Chalder, S Hirsch, P Wallace and D Wright
Claims a prevalence of 2.6% for CFS (CDC 94 criteria) in the UK.
 

oceanblue

Guest
Messages
1,383
Location
UK
Fatigue vs Psychological morbidity

This relates to the Pawlikowska paper and had been discussed on the PACE thread after featuring in a recent talk by Simon Wessely.

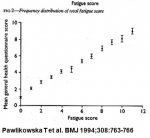
Fig 3 from this paper shows Chalder Fatigue score vs mean score for the General Health Questionnaire (GHQ-12), with a very strong correlation between the two. For convenience, I've reproduced it here as it's freely available in the open access document above; if anyone thinks this is a breach of copyright please let me know.
fatigueghq.jpg

from PACE thread
Regarding the slide from this paper:
some of us dissected this graph in this thread (started a few posts in): http://forums.phoenixrising.me/show...a-should-not-be-exclusion-criteria-for-ME-CFS

Basically, the GHQ-12 measures various symptoms incl. some physical symptoms so describing it as a measure of psychological distress is somewhat misleading. The same problem of confounding is probably related to a lot of the points made.
I think that graph was CDC symptoms (inc fatigue) vs psychological morbidity (using the CIS-R) from a sister paper, but it's a similar idea.

I'd agree that GHQ-12 points such as not 'been able to concentrate on whatever you are doing' or a feeling that you can't play a useful part in things, can be a direct result of ME rather than any useful measure of psychological health. Also, as the study isn't prospective it doesn't say anything about the direction of the relationship. Fatigue and psychological health may both be linked by a strong correlation to physical health.

However, there is another, simpler explanation for the findings (and I like simple).

All particpants were asked what cause they attributed to their fatigue:
- 40% cited psychosocial causes eg work stress
- 17% cited psychological causes
- 15% cited physical causes
- 20% didn't answer this question, 7% cited other causes and 2% cited pregnancy.
Only 0.25% cited CFS.

So what we are looking at here is a graph of explained fatigue and, unsurprisingly, the most common cause of fatigue is psychological/psychosocial, but physical illness also causes fatigue. So what? CFS is about unexplained fatigue, and the graph tells us nothing about that.

Nice graph, strong correlation but it tells us nothing about whether or not psychological factors account for unexplained fatigue. So it's "disappointing" that Simon Wessely used the slide to imply a causal relationship between psycholgical problems and unexplained fatigue.
 

Enid

Senior Member
Messages
3,309
Location
UK
I am glad you are able to analyse oceanblue (am sure many others can too) but when these names come up I tend to get a serious health warning. Still being cited and influential is a worry, so the "research" should be exposed for what it is.
 

Dolphin

Senior Member
Messages
17,567
This relates to the Pawlikowska paper and had been discussed on the PACE thread after featuring in a recent talk by Simon Wessely.

Fig 3 from this paper shows Chalder Fatigue score vs mean score for the General Health Questionnaire (GHQ-12), with a very strong correlation between the two. For convenience, I've reproduced it here as it's freely available in the open access document above; if anyone thinks this is a breach of copyright please let me know.
View attachment 5539


I think that graph was CDC symptoms (inc fatigue) vs psychological morbidity (using the CIS-R) from a sister paper, but it's a similar idea.

I'd agree that GHQ-12 points such as not 'been able to concentrate on whatever you are doing' or a feeling that you can't play a useful part in things, can be a direct result of ME rather than any useful measure of psychological health. Also, as the study isn't prospective it doesn't say anything about the direction of the relationship. Fatigue and psychological health may both be linked by a strong correlation to physical health.

However, there is another, simpler explanation for the findings (and I like simple).

All particpants were asked what cause they attributed to their fatigue:
- 40% cited psychosocial causes eg work stress
- 17% cited psychological causes
- 15% cited physical causes
- 20% didn't answer this question, 7% cited other causes and 2% cited pregnancy.
Only 0.25% cited CFS.

So what we are looking at here is a graph of explained fatigue and, unsurprisingly, the most common cause of fatigue is psychological/psychosocial, but physical illness also causes fatigue. So what? CFS is about unexplained fatigue, and the graph tells us nothing about that.

Nice graph, strong correlation but it tells us nothing about whether or not psychological factors account for unexplained fatigue.
Yes, good points. And good you corrected my error.

I have found it frustrating on occasion coming across very flawed old papers, which nobody else replied to, but not having the chance to write in as the time had passed. It's one of the things that motivates me to prioritise letter writing.
 

oceanblue

Guest
Messages
1,383
Location
UK
Pawlikowska population fatigue study vs Norwegian fatigue study

The Pawlikowska study was the ultimate source for the 'normative' fatigue levels used by PACE trial (see below for full post on this, taken from the main PACE thread). However, a Norwegian study that also used the Chalder Fatigue Questionnaire found lower levels of fatigue than Pawlikowska, even though it used an older population (age 19-90).

Crucially, the Norwegian study was based on a representative sample of the population, taken from Norway's National Population Register. Both studies used the same definition of fatigue 'caseness' as the PACE protocol, a bimodal score of 4 or more. Here are the results compared:
Pawlikowska; Norwegian study
Mean fatigue score (SD): 13.6 (4.5)*; 12.2 (4.0) [nb normal health scores 11]
Fatigue case (1 month): 38%; 22%
Fatigue case (6 months or more): 18%; 11.4%

*estimated from data given for score bands e.g. 11-12, 13-14, exact data not given

So, using the same scale but a representative sample the Norwegian study found much lower levels of fatigue than Pawlikowska, a study that did not use a representative sample. Nb a separate study on the SF36 scale did not indicate substantial differences in fatigue between the UK, US and Sweden, indicating that the Norwegian data is likely to be representative of the UK too.


that post from the PACE thread:
PACE set a threshold of 'normal' fatigue as a CFQ score of 18 or less, based on a mean of 14.2 and SD of 4.6, which were taken from a 2010 study, Measuring fatigue in clinical and community settings. But these figures may well not be representative of the working age population.

The way they selected the participants is complex, and the underlying data was collected published in 1994: Population based study of fatigue and psychological distress (T Pawlikowska, T Chalder, S R Hirsch, P Wallace, D J M Wright, S C Wessely), and this is where the holes start appearing.

Crucial bit is point 4 if you're pressed for time.

1. This does not appear to be a representative sample
They mailed registered patients at several different types of practice, but made no attempt to match them to the population (vs Bowling who showed SF36 data was based on a cohort well-matched with census data).
We sent questionnaires to all patients aged 18 to 45 years registered with selected practices, 3 from London and three from rural or semirural settings.

Two practices (subsequently referred to as practice 1) were working from the same health centre in south London in a mixed urban community with a large amount of temporary accommodation. Practice 2 was an inner city London practice where most patients were socially deprived. The third practice was located on the Surrey-Hampshire border with patients predominantly in socioeconomic classes II and III. Practice 4 was in an urban area of a south coast port, and the last practice was in a Somerset village, with a static close knit community and many stable families. The total number of patients aged 18-45 registered with the practices was 31 651 (15 222 men, 16 429 women).

- They restriced it to patients age 18-45, though didn't explain why (though this particular feature is likely to bias towards healthier individuals).

2. Low response rates could lead to biased findings
The response rate was only 48%. After investigating non-responders they found that many had moved (a known problem with GP practices, esp in urban areas) and estimated the response rate from those who received the questionnaire was 64%. The issue is, were people who were less well, or fatigued, more likely to respond to questionnaires about fatigue and health?

By comparison, the Bowling SF36 data used face to face interviews, with a 78% response rate and the SF36 qs were part of a much broader questionnaire including lifestyle and finance - so healthy people are less likely to ignore because it doesn't apply to them. The Jenkinson SF36 figures had a 72% response rate, but this is of those mailed. Let's say 5% of the orginal list they mailed was incorrect/moved (quite a cautious assumption from my direct marketing experience) giving a net response rate of 76% - and again this was part of a larger survey including lifestyle, reducing the chance of healthy people opting out.

ETA: however, this study suggests that ill people might not be more likely to respond, though it does relate to questions on "subjective well-being (overall life satisfaction and self-assessed health)" rather than just health.

3. Only participants who visited their GP were included
To complicate things, Cella didn't use all the data from the original mailing. Instead, data was only used from respondents who subsequently visited their GP about a viral or other complaint and were selected as part of another study. So anyone who was very healthy and never visited their GP would not be included. Those who visited their GP more often would consequently have more chances to make this cohort than those who rarely visited their GP. All of this is likely to bias the sample against healthy individuals.

Precise figures are not given for the original 1994 study but from the figures they give it looks like the mean is very close to 13.7, compared to the 14.2 quoted by Cella for his sub-group, suggesting at least some bias here.
ETA I've found the fatigue case data for the Cella study (Postinfectious fatigue: prospective cohort study in primary care, p1335 under "stage 2 sample"): it gives 42.6% caseness, vs 38% for Pawlikowska, confirming the Cella cohort is more fatigued than the Pawlikowska one.

4.Data from the original study indicate this is an unhealthy cohort.
According to Pawlikowska, 38% of patients had a score about the original Chalder bimodal cut off of 3 (as used in the PACE protocol) and 18.3% of patients were substantially fatigues for 6 months or longer. Whoa, that looks unhealthy, esp as the paper quotes a 1990 paper that found only 10% of GP practice patients had fatigue for one month or more. I think there are some US studies indicating fatigue of over 6 months in the population is much less than 18%.
 

Enid

Senior Member
Messages
3,309
Location
UK
Thanks for your analysis oceanblue - looks like the psychs are trying to psychologise us all in one way or another - "gods of the gaps" as another member described them. (Chalder's training - psychiatric nursing).
 

oceanblue

Guest
Messages
1,383
Location
UK
Summary of the Wessely Primary Care study

It would probably help to explain the basic structure of this study: the overall design is pretty good, perhaps one reason why the papers that emerged from the study became quite influential. The study has 4 stages:

Stage I: The Prequel
Everyone registered with 6 primary care practices in the south of England and aged 18-45 was mailed the Chalder Fatgiue Questionnaire (CFQ) and the General Health Questionnaire (GHQ, used as a measure of psychological health). The data was used to measure 'pre-visit' health.

Stage II: The Visit
2 cohorts, each of around 1,000 patients:
  • Viral cohort: patients visiting the practice with suspected viral infections, age 18-45
  • Non-viral cohort: next patient to visit with non-viral complaint, age 18-45
Again, the GHQ-12 and CFQ questionnaires were used.

Stage III: 6 month follow-up
Both cohorts were contacted 6 months later, again using the GHQ-12 and CFQ questionnaires.
Responders (Viral & non-viral cohorts) were sub-divided into Chronically Fatigued (fatigued for 6 months ie at Stage II & III) and non-fatigued patients

Stage IV: Detailed work-up of Stage III (case control study)
All Chronically Fatigued subjects were asked to return for further assessment, along with matched non-fatigued controls (ie for every fatigue case, one non-fatigued patient of the same age and sex was selected) for both viral and non-viral cohorts, giving:
  • Viral cohort: fatigued
  • Viral chohort: matched non-fatigued controls
  • Non-Viral cohort: fatigued
  • Non-Viral chohort: matched non-fatigued controls
This was the point at which full-blown CFS was assessed for the first time, along with psychological morbidity via the CIS-R interview and symptoms via the Somatic Symptom Checklist (including the CDC-94 symptoms).

So far, so good...
 

oceanblue

Guest
Messages
1,383
Location
UK
Serious flaw in study showing 'common infections don't lead to CFS'

Postinfectious fatigue: prospective cohort study in primary care, 1995 (pdf), Wessely S, Chalder T, Hirsch S, Pawlikowska T, Wallace P, Wright DJ.

This study compared a cohort of around 1,000 patients who went to see their doctor with a viral illness with a matched cohort of patients seeing their doctor for other reasons - and found no difference in their rate of CFS 6 months later:
Our study shows no evidence that common infective
episodes in primary care are related to the onset of chronic
fatigue or chronic fatigue syndrome.

Unfortunately, it appears that the study failed to exclude any existing cases of CFS in both cohorts - it wasn't looking at NEW cases after infection, it was looking at total cases (of which new cases would only be a small proportion). So it's unsurprising there was little difference between the 2 cohorts.

See the above post (#7) for an outline of the methodology.

The main results for CFS 6 months after visiting the surgery show similar rates for the viral and non-viral cohort

Chronic Fatigue: 9.9% (Viral), 11.7% (non-viral)
Oxford CFS: 1.3%, 1.9%
CDC '94 CFS: 1.0%, 2.0%

But wait, 2% of patients have CFS 6 months after visiting their doctor with a non-viral complaint?! Something odd is going on here, and that odd something is that the paper does not state at any point that existing CFS cases are excluded. Oh. In fact, it does note that:
The strongest independent predictors
of postinfectious fatigue were fatigue assessed before
presentation with clinical infection (3.0 [1.9-4.7])...

...Since previous fatigue was strongly associated with
subsequent chronic fatigue, it is possible that any
association between infection and fatigue was obscured by
the high rate of preinfection fatigue in the study sample.
We therefore repeated analyses for those without previous
fatigue only [ie low fatigue at Stage I].
Ah. These results look rather different:

Chronic Fatigue: 4.6% (Viral), 4.2% (non-viral)
Oxford CFS: 0.8%, 0%
CDC '94 CFS: 0.9%, 0.4%

As the number of cases are so small the differences between viral and non-viral is not significant but the picture looks very different.

In short, there's nothing you can conclude from this study about the link between common acute infections and subsequent develoopment of CFS

Also, the 'viral' cohorts in not quite what you might expect: 36% were diagnosed as Flu (19%), Cold (16%) and Glandular Fever (1%) but the most common diagnosis was 'sore throat' (33%) and the rest were other ailments.
 

Dolphin

Senior Member
Messages
17,567
But wait, 2% of patients have CFS 6 months after visiting their doctor with a non-viral complaint?! Something odd is going on here, and that odd something is that the paper does not state at any point that existing CFS cases are excluded. Oh. In fact, it does note that:

The strongest independent predictors
of postinfectious fatigue were fatigue assessed before
presentation with clinical infection (3.0 [1.9-4.7])...

...Since previous fatigue was strongly associated with
subsequent chronic fatigue, it is possible that any
association between infection and fatigue was obscured by
the high rate of preinfection fatigue in the study sample.
We therefore repeated analyses for those without previous
fatigue only [ie low fatigue at Stage I].


Ah. These results look rather different:

Chronic Fatigue: 4.6% (Viral), 4.2% (non-viral)
Oxford CFS: 0.8%, 0%
CDC '94 CFS: 0.9%, 0.4%

As the number of cases are so small the differences between viral and non-viral is not significant but the picture looks very different.

In short, there's nothing you can conclude from this study about the link between common acute infections and subsequent develoopment of CFS

Also, the 'viral' cohorts in not quite what you might expect: 36% were diagnosed as Flu (19%), Cold (16%) and Glandular Fever (1%) but the most common diagnosis was 'sore throat' (33%) and the rest were other ailments.
Thanks oceanblue. Those incidence figures are a lot lower than say the Dubbo study found for a few confirmed specific infections; generally the incidence is around maybe 10% although given that a lot of these seem to get better pretty quickly, I can be slightly reluctant to say some are "proper" cases.

A general problem I have with a lot of these studies that look at pre-disposing factors e.g. before a viral infection (I think some of these studies looked at that) is that many patients many not be in a "pre" state at all but instead have undiagnosed ME/CFS; some may have symptoms while others may not have that many symptoms but this is because they have adjusted their life in some way e.g. for the years I was going around undiagnosed, I generally had to give up any competitive sports and ration my social activities which also made me feel a bit unhappy and frustrated - not depressed as I could laugh easy but sometimes unhappy that I couldn't do everything I wanted, etc. It could hit other people worse e.g. people around them could be getting annoyed with them for not "pulling their weight" which could cause extra strife, etc. So I'll feel more confident with studies looking at pre-disposing factors when they are better at testing for it (and also when studies actually employ such tests i.e. it's no good having good tests if "cheap" paper research doesn't actually use them).
 

oceanblue

Guest
Messages
1,383
Location
UK
Study claiming 2.5% prevalence rate for CFS didn't diagnose properly

The prevalence and morbidity of chronic fatigue and chronic fatigue syndrome: a prospective primary care study. 1997. S Wessely, T Chalder, S Hirsch, P Wallace and D Wright
Full text pdf


This study found a CFS prevalence rate of 2.6% for CDC '94 (Fukuda) criteria but failed to evaluate patients according to the published critieria. It excluded only a suspiciously-small proportion of them due 'explained fatigue' and so the stated rate is almost certainly a huge overestimate.

Reality check
These prevalence figures fail a basic reality check: 1 in 40 people having CFS/ME is not credible. In the UK, primary care doctors have around 1,500 registered patients each (almost the entire population is registered) which would give them nearly 40 CFS patients each. At the time the study came out, many doctors pointed out they have only a handful or less of CFS patients each.

2 population studies found much lower rates for CFS: Jason 1999 found 0.42% and Reyes 2003 found 0.24%. The Reeves 2007 study, which used the wacko Empirical Criteria that allows fatigue purely due to depression, found a similar rate of 2.5% - which again makes the Wessely figures look suspiciouly high.

Study flaws
See the above post (#8) for an outline of the methodology.
The key problem seems to be that the study didn't properly clinically evaluate patients as required by the CDC/Fukuda definition (pdf)
The presence of prolonged or chronic fatigue requires
clinical evaluation to identify underlying or contributing
conditions that require treatment. Further diagnosis or
classification of chronic fatigue cases cannot be made
without such an evaluation.
Fukuda requirements:
  1. Thorough history of medical and psychological circumstances at the onset of fatigue - as well as many other factors
  2. A mental status examination
  3. A thorough physical examination
  4. A minimum battery of lab screening tests
By contrast, there the study used no physical examination; only some of the lab tests; no thorough medical history (they just used existing patient notes); and the CIS-R questionnaire that only looks at overall psychological health but doesn't diagnose any specific disorders which is necessary to apply exclusions.

Tiny level of exlusions
Only 3 patients (about 7%) of patients were excluded from CFS due to medical exclusions. Another 3 were excluded from the Chronic Fatigue group due to lab test results: these 3 may or may not have met the critieria for full CFS.

This level of exclusion is minimal compared with the Jason and Reyes studies, both of which used a detailed medical history, physical examination, proper psychiatric evaluation and battery of lab tests as required by Fukuda. Their clinical evlauations excluded 73% (Jason) and 77% (Reyes) of their 'CFS-like' patients for physical or psychiatric reasons. However, a substantial number of patients had been excluded by the questionnaires even before the clinical evaluation, so the total exclusion rates were even higher.

The Wessely study suggested that one reason for the low level of exclusions is they only looked at patients aged 18-45, but 67% of the Jason population and 61% of the Reyes population were in the same age group so this is highly unlikely to explain the massive differences (especially as psychological disorders are common in younger people).

The 2.6% prevalence rates lacks credibility.
 

oceanblue

Guest
Messages
1,383
Location
UK
A general problem I have with a lot of these studies that look at pre-disposing factors e.g. before a viral infection (I think some of these studies looked at that) is that many patients many not be in a "pre" state at all but instead have undiagnosed ME/CFS
Agreed. Having a diagnostic test would make life a lot easier.
 

Dolphin

Senior Member
Messages
17,567
Thanks for the analysis of the paper, oceanblue - well done.

In some studies, if there is not an assessment of cases individually by a clinician, ordering whatever tests they might think is necessary, people are classed as "CFS-like" rather than CFS cases.

Another thing I remember finding odd about that paper was that the prevalence for the Oxford criteria (without comorbid psychological disorder) was actually lower than the Fukuda prevalence (2.2% vs 2.6%).
 

oceanblue

Guest
Messages
1,383
Location
UK
Another thing I remember finding odd about that paper was that the prevalence for the Oxford criteria (without comorbid psychological disorder) was actually lower than the Fukuda prevalence (2.2% vs 2.6%).
Very odd, especially as after excluding those with 'psychological morbidity' the Oxford criteria rate was higher than CDC (0.7% vs 0.5%), wheras given the nature of the Oxford Criteria you would expect it to be lower. Further evidence, I think, that the figures are unreliable.
 

Snow Leopard

Hibernating
Messages
5,902
Location
South Australia
The thing about these 2.2-2.6% incidences, is that when you compare them to the associated 'recovery' rates, (a) either those recovery rates are misreported (b) Most of the group suffers from a relapse-remitting disease, resulting in the recovery rates being flawed due to lack of time series studies. (the CDC suggested this in one of their papers - inconsistent results from one period to the next) (c) Or around 4-5% of the population has suffered from 'chronic fatigue syndrome' some time in the past.
What I'd really like to see is a population study measuring the numbers of those who have greater severity - unable to work for over 3 years for example - then we'd probably find our more familiar 0.2-0.5%.
 

SilverbladeTE

Senior Member
Messages
3,043
Location
Somewhere near Glasgow, Scotland
Nielk,
hehe! ;)

Oh did you see a report said that troops serving in Afghanistan are suffering higher rates of mental illness?
yet Weasely had concluded there was no unusual rates of PTSD, from there...
Ah, the wheels of justice grind oh so slow, but so exceedingly fine! :p

Silverblade's Thought For Today:
The impact of the Weasels on the plight of ME Sufferers, is analogous to the impact of diahorea on your underwear! :D
 

Enid

Senior Member
Messages
3,309
Location
UK
Trying to sweep all into their "spiders" web degree by creeping degree. Just wondering if I dare do the washing up without worrying about my "attitude" to it.
 

oceanblue

Guest
Messages
1,383
Location
UK
More concerns about the accuracy of their CFS 'CDC-94' diagnosis

I've already commented on the implausibly high prevalence rate of 2.5% (1 in 40) for CFS found by the study - probably due to a failure to exclude patients with explained fatigue - but I've noticed a few more factors that might be relevant.

1. CFS was primarily diagnosed via the 'Chronic Fatigue Questionnaire'; this unpublished, unvalidated questionnaire came from Trudie Chalder's 1990 MSc Thesis. The study fieldwork for all these papers was carried out in 92/93 - yet the Fukuda/CDC-94 criteria the study uses weren't published until 1994 (obviously). Did they use time travel to make sure they had the right criteria for their fieldwork? I emailed Trudie Chalder to request a copy of her questionnaire but as yet have received no reply.

2. They refer to 9 (or more, Wessely 1996) CDC symptoms when there are only 8. Table 5 of this paper list 9 symptoms first that appear to be their CDC ones yet includes 'muscle weakness' and 'fever/chills' that are NOT CDC symptoms, but misses out 'sore throats' that is a CDC symptom. They may have diagosed some case of CFS on the basis of the wrong symptoms.

3. The authors say they only did some of the mandatory CDC-94 lab tests 'for reasons of cost'. What kind of an excuse is that?
 
Back