• Welcome to Phoenix Rising!

    Created in 2008, Phoenix Rising is the largest and oldest forum dedicated to furthering the understanding of, and finding treatments for, complex chronic illnesses such as chronic fatigue syndrome (ME/CFS), fibromyalgia, long COVID, postural orthostatic tachycardia syndrome (POTS), mast cell activation syndrome (MCAS), and allied diseases.

    To become a member, simply click the Register button at the top right.

PACE Trial and PACE Trial Protocol

Angela Kennedy

Senior Member
Messages
1,026
Location
Essex, UK
Meanwhile, back at that histogram, I showed it to another friend with experience in statistics at lunch today. While I was explaining the meaning of the various parts, I realized the histogram shows no change at all over the range from 25 to 65. No movement within that range should be taken as statistically significant in terms of the general population, even after you switch to a non-normal distribution with kurtosis and skew. Quantization of scores makes the entire PACE trial virtually meaningless.

Bloody hell. What did your friend think of it all then?
 

Angela Kennedy

Senior Member
Messages
1,026
Location
Essex, UK
He was speechless.

So we've got multiple confounders in the methodology with some serious ethical concerns, followed by statistical results that do not support their claims, indeed are 'meaningless' enough to render someone knowledgeable about quantitative method 'speechless'. Blimey.
 

Dolphin

Senior Member
Messages
17,567
apologies, this is a bit long, but oh-so worth it :D

We used continuous scores for primary outcomes...

Part 2 - The Lancet paper: Abandoning the protocol, instead mean changes in fatigue and physical function scores were compared. A clinically important difference was defined as a gain of 0.5 Standard Deviation (SD) or more:

A clinically useful difference between the means of
the primary outcomes was defined as 0•5 of the SD of
these measures at baseline, equating to 2 points for
Chalder fatigue questionnaire and 8 points for short
form-36.

Results - difference in means
Fatigue: CBT -3.4; GET -3.2 (both relative to SMC), target = -2
Physical Function: CBT +7.1; GET + 9.4 (both relative to SMC), target =+8

Problems with the way ‘clinically useful difference' was calculated.
There’s a lot of debate about the best definition of a ‘clinically useful difference’ and the choice of 0.5 STandard Deviation (SD) of baseline scores itself is not particularly controversial (given that they’ve changed the primary outcomes...). However, the Guyatt paper PACE cites in support of the 0.5 SD method notes that if the participants are particularly homogenous (with less variation between their baseline scores) that will lower the SD and therefore lower the threshold for a clinically useful difference.

Now, in some ways the PACE trial have selected a relatively homogenous sample for fatigue and physical function because they used explicit fatigue and activity thresholds to recruit patients (SF-36<70, CFQ>5) and an implicit threshold because housebound patients were too ill to take part - lets assume a SF-36 of 30 is needed to be well enough to get to the trial for therapy.

So for SF-36, baseline participants’ scores are effectively restricted to 30-65. That leads to a lower SD and in turn to a lower threshold for clinical difference. If, for instance, the SD had come out at 20 rather than about 16, the threshold for clinical difference would have been 10 and in this case neither GET nor CBT would achieve a ‘clinically useful difference’. (CBT 7.1, GET 9.4).

The situation is even worse for the Chalder Fatigue scale because of its well-known ceiling effect, whereby it’s easy for participants to hit the maximum score of 33 (baseline mean was about 28). Consequently, instead of participants scoring, say, 33, 34, 35 or 38 they all score 33 – this further reduces the variance in the sample, which reduces the SD and so in turn lowers the threshold for a ‘clinically useful difference’. This could explain why the clinically useful score is only 2. My feeling is that derivation of this score of 2 is not credible, because of problems with the scale itself, and the relatively homogenous group of participants.

So, if the fatigue scale threshold is dodgy, that leaves the only primary outcome as the SF-36 and CBT already fails to reach this, with a mean difference of 7.1 vs a target of 8. The relatively homogenous sample of patients casts further doubt on whether 8 is too low, which could then rule out GET too as not being ‘useful’.

Added to this is the fact that fatigue and physical function scores are subjective, self-rated measures prone to reporting bias. When we look to the objective measures for confirmation, it turns out that CBT 6MWT did not improve significantly, though GET did.

So the published data used more ‘sensitive’ measures of difference but even then the therapy groups barely scraped over the new, much closer finishing line.

Given the problems inherent in using subjective measures, and issues over whether the ‘clinically useful’ threshold is artificially low, there must be real doubts over whether the primary outcome figures support the authors’ claim of ‘moderate effectiveness’ for CBT & GET.
One way to convince people of this point is to point out the SMC results:
Fatigue - 65% went up by 2 points or more
Physical Functioning - 58% went up by 8 points or more
Both: 45%

The first two in particular are very high figures for a clinical useful difference. I wonder would they be happy if some complementary therapy they disagreed with used this sort of threshold?
 

anciendaze

Senior Member
Messages
1,841
Just realized I need to clarify what I meant about the histogram. If anyone catches me in an error, please tell me.

The authors of the PACE study report have assumed we are a subset of the general population, which because of 'false illness beliefs' have become sedentary and deconditioned. They represent this subpopulation statistically as having a distribution of physical activity scores using a normal distribution with a mean of 85 and an SD of around 30, though they seem to have trouble deciding what SD they really want. What jumped out at me while looking at the histogram was the possibility of a very different statistical model for the population being sampled by the study. I could assume a uniform distribution of scores between 25 and 65. This is the kind of statistical behavior you can model with a spinner or roulette wheel. Each number between 25 and 65 can be assigned equal probability.

The difficulty only gets worse when you remember that quantization makes the first scores clearly outside the range 20 and 70. This covers everyone who entered the trial, and the vast majority who completed it. A bounded random walk does a great job as a model. If you assume those dropping out would have had low scores which pull group measures down, you have a great null-hypothesis to explain apparent gains. GET may have been a particularly good way of deselecting those who felt the whole business was a waste of their time and very limited energy. It shows a real correlation with 'adverse events'. We all know how unpleasant these can be.
 

Sean

Senior Member
Messages
7,378
He was speechless.

That's nice, but if he has any technical authority he needs to speak out in the proper scientific forums. Like, for example, The Lancet. Or seriously bend the ears of his colleagues who do have that authority and can speak out.
 

Angela Kennedy

Senior Member
Messages
1,026
Location
Essex, UK
That's nice, but if he has any technical authority he needs to speak out in the proper scientific forums. Like, for example, The Lancet. Or seriously bend the ears of his colleagues who do have that authority and can speak out.

Unfortunately we do find few people who don't have a specific interest are willing to 'speak out'. Let's face it, those who do face a hard time. I'm speaking as an academic myself here. Because I have a specific 'interest' I've spoken out on a number of occasions, and have been subject to specific attacks related to my academic position among other things.

No-one without a specific 'horse in the race' here is likely to want to put themselves through that.

Even ME/CFS scientists/clinicians have for the most part been extremely quiet about this so far. That may change. I do hope so.
 

oceanblue

Guest
Messages
1,383
Location
UK
One way to convince people of this point is to point out the SMC results:
Fatigue - 65% went up by 2 points or more
Physical Functioning - 58% went up by 2 points or more
Both: 45%
The first two in particular are very high figures for a clinical useful difference. I wonder would they be happy if some complementary therapy they disagreed with used this sort of threshold?

Yes, they do seem strangely high figures for what is supposed to be a standardised form of best GP practice.
 

Sean

Senior Member
Messages
7,378
You are right, Angela. My point was only that we can't do it alone. At least some senior academics, clinicians, and researchers, (like Prof Hooper), have to speak out as well.

They do not need to be ME/CFS experts to make legit, authoritative comments. For example, surely there are some professional statisticians out there who can publicly comment on these statistical and definitional issues, independent of the disease itself. These issues are methodologically problematic in any experimental setting.
 

Marco

Grrrrrrr!
Messages
2,386
Location
Near Cognac, France
Check out table 3 of the PACE paper which gives mean SF36 scores and their standard deviations at baseline.

Totalling the mean plus 1 SD above mean for each group gives you a score of approximately 54. The revised eligibility score for entry was 65.

So by reckoning, approximately 16% started the trial with a SF 36 score between 54 and 65.

Not too difficult to achieve a SF 36 score of 60 from that baseline!
 

Angela Kennedy

Senior Member
Messages
1,026
Location
Essex, UK
You are right, Angela. My point was only that we can't do it alone. At least some senior academics, clinicians, and researchers, (like Prof Hooper), have to speak out as well.

They do not need to be ME/CFS experts to make legit, authoritative comments. For example, surely there are some professional statisticians out there who can publicly comment on these statistical and definitional issues, independent of the disease itself. These issues are methodologically problematic in any experimental setting.

No- you're right Sean. I agree, we can't do it alone. I have a few ideas of some such people who to approach myself- but don't want to make it too public at this stage, for obvious reasons lol!
 

wdb

Senior Member
Messages
1,392
Location
London
The authors of the PACE study report have assumed we are a subset of the general population, which because of 'false illness beliefs' have become sedentary and deconditioned. They represent this subpopulation statistically as having a distribution of physical activity scores using a normal distribution with a mean of 85 and an SD of around 30

I thought 85 was the mean of the general population and the subgroups in the trial had mean scores in the range of 40-60
 

oceanblue

Guest
Messages
1,383
Location
UK
Check out table 3 of the PACE paper which gives mean SF36 scores and their standard deviations at baseline.
Totalling the mean plus 1 SD above mean for each group gives you a score of approximately 54. The revised eligibility score for entry was 65.
So by reckoning, approximately 16% started the trial with a SF 36 score between 54 and 65.
Not too difficult to achieve a SF 36 score of 60 from that baseline!
Very interesting, esp given 15% of the SMC group hit the 'within normal' score (though for both fatigue as well as SF36).
Also, not that SF-36 is scored in 5 point increments so 54 is really 55, and would require improving only one 'tick' to reach the threshold of 60 (eg just one answer changing from 'limited a little' to 'not limited at all').
 

oceanblue

Guest
Messages
1,383
Location
UK
"Per-protocol" webappendix results: what do they show?

I'm confused by Web Appendix Table B
"Per protocol sample analysis of co-primary outcomes of fatigue and physical function"
I'd hoped this would show primary outcome analysis according to the protocol (ie what proportion of each group improved by 50% or more). But it seems very similar to Table 3 of the Lancet paper "Primary outcomes of fatigue and physical function", but with very slightly different values.

Any explanations gratefully received.
 

anciendaze

Senior Member
Messages
1,841
populations and samples

I thought 85 was the mean of the general population and the subgroups in the trial had mean scores in the range of 40-60
I'm at a disadvantage here because some important assumptions in the PACE trial were not spelled out. What follows is my own interpretation. Check it over, because I can and have blundered while trying to interpret whatever it is they are doing.

The general population data from the referenced studies has a large mode around 100. The mean appears to be close to that. We don't know about the subpopulation with ME/CFS because there has never been anything approaching a full population study. It looks like the authors assumed a sedentary subpopulation of the general population is the one with mean 85. This is basically a guess. ("We know in advance that these people are merely sedentary members of the general population with poor mental hygiene.") It has substantial impact on statistical tests of significance.

The next level of analysis takes us to the sample of the population actually in this study. There is no particular problem doing numerical calculations to find mean and standard deviation for the sample. Most of their numbers refer to this sample.

The realization which stunned me, and presumably my speechless friend, was that we could use a different assumption about the subpopulation from which the sample was drawn. With a uniform distribution, the mean and variance are merely numbers entirely determined by the bounds on the interval. There is no mode because all values are equally likely. There is no central tendency whatsoever.

This would say the clustering and standard deviation in the sample were entirely the result of the sampling process. The numbers tell you nothing about the distribution of scores for the subpopulation from which patients were drawn beyond that fact that it exists and spans the range of patient scores.

People can certainly argue that my suggested assumption about the subpopulation is wrong, or unreasonable. They would have a much harder time showing it would not produce the results shown by the study. In that case, the calculated standard deviations are meaningless for statistical inference. The effects of natural and artificial bounds predominate over any results from the study.
 

biophile

Places I'd rather be.
Messages
8,977
Age appropriate comparisons for physical functioning, and other smoking guns?

Unimpressive results when compared to actual healthy populations, flawed definitions of "normal" for both the primary measures, questionable processing of potential participants, strawmanned version of pacing, omitted measurements, massive goalpost shifting, lack of actigraphy at follow up which they know would probably show no improvement, unexpected improvement trends in the "control" group (at least half as much as CBT/GET), possible reactivity bias (placebo response, observer-expectancy effect, Hawthorne effect), ceiling effect of the Chalder fatigue questionnaire, stated conflicts of interest in the paper itself, anything important I miss?

For anyone willing to look beneath the surface results, the PACE trial ironically shows that contrary to the uncritical hyperbole surrounding it, the rationale and effectiveness of CBT/GET is unconvincing even when the researchers have ample resources, a carefully selected cohort, a highly controlled environment using their best methods refined over 20 years, a chance to redefine expectations, and an opportunity to dress up the data to make it look better than it really is.

It really is incredible what these people are getting away with publishing and how everyone has been hoodwinked by it. How dare we question "respected experts" writing in one of the most "prestigious journals" in the world? The trial itself and the glowing reviews about its methodology and results, these are an insult to science and a disturbing punch to the face of the ME/CFS community. I hope sooner or later someone with academic clout will notice these flaws and publish a paper.

Unravelling the PACE trial obviously has revealed several major flaws which have been discussed on this thread (well done everyone!), but I think one of the most dramatic and visually impressive to casual observers would be the dubious definition of "normal" scores on the physical functioning subscale of the SF-36. As I said before, my friend became instantly suspicious after seeing that, and he isn't really all that interested in ME/CFS. I am wondering if this is a smoking gun, a clear example of ideological hyperbole and spin doctoring.

In Table 3 of the PACE paper, a rather "modest" improvement was reported for this measure after 52-weeks. On a scale of 0-100, the CBT group reported an additional 71 point improvement over "specialised medical care" (SMC), and 94 points for GET. 28% of those receiving CBT, and 30% for GET, were within "normal" ranges for both primary outcomes at 52 weeks, compared with 15% for SMC.

The defined threshold of "normal" scores for PF/SF-36 was "equal to or above the mean minus 1 SD scores of the UK working age population of 84 (24) for physical function (score of 60 or more)", citing [Bowling A, Bond M, Jenkinson C, Lamping DL. Short form 36 (SF-36) health survey questionnaire: which normative data should be used? Comparisons between the norms provided by the Omnibus Survey in Britain, The Health Survey for England and the Oxford Healthy Life Survey. J Publ Health Med 1999, 21: 25570.] http://jpubhealth.oxfordjournals.org/content/21/3/255.full.pdf

Did PACE use the data from this to calculate a new figure rather than use any single figure already given?

As others have already pointed out, Figure 1 of Bowling et al provides a histogram of physical functioning with a normal plot, for the general population. Because the distribution is heavily skewed towards the 100 point ceiling, 1 SD below the mean is an unusually low threshold, as the vast majority of people are scoring 80-100 points, and even then the trend is still at the top end of that range.

The average age of the participants in the PACE trial was 38 years (SD = 11?), so it is also worthwhile looking at these age groups in the general population rather than the entire "working age population".

Extracted from "Table 3: Mean (SD) scores for the SF-36 dimensions by age and sex and social class and health variables" (emphasis added):

[Physical functioning]

16-24: mean=95.5 (SD=12.1, n=204)
25-34: mean=94.5 (SD=13.5, n=415)
35-44: mean=93.3 (SD=13.4, n=319)
45-54: mean=87.2 (SD=20.9, n=297)

55-64: mean=78.0 (SD=26.3, n=297)
65-74: mean=72.7 (SD=26.7, n=281)
75-84: mean=57.9 (SD=28.6, n=296)
85+: mean=39.3 (SD=31.5, n=36)

Cut down activities because of illness (in last 2 weeks)...
Yes: mean=63.0 (SD=33.4, n=319)
No: mean=87.7 (SD=20.2, n=1722)

Long-term health problem...
Yes: mean=52.3 (SD=28.9, n=449)
No: mean=92.7 (SD=13.1, n=1590)

Using data for the 35-44 year old age group, mean=93.3 and SD=13.4, and using the PACE definition the threshold for normal, would be 80 not 60. AFAIK those figures for each age group are not even the healthy population, but the general population including people with illness, if so, even 80 is being too generous, although perhaps PACE wanted to imply that almost a third of the CBT and GET groups were "normal" enough to "work".

On average, the CBT and GET groups are still reporting similar PF/SF-36 scores as people in the population who have cut down activities because of illness in the last 2 weeks and/or have a long-term health problem and/or are well over 75 years old. 80 points is even higher than their original threshold of 75 points before it was changed to 60 points.

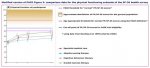
A number of PR forumites have expressed their suspicion that the PACE authors dishonestly presented the data. So I wondered what a more "honest" presentation would look like. Here is a modified version of Figure 2 from PACE, which has full scaling instead of being truncated as in the paper, and includes the above information:

attachment.php


Graphs really are our friend here. It is more effective to illustrate a reality check for the hyperbole using visual representations than a bunch of figures, it just takes a hell of a lot more time!

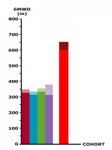
Another (unfinished) graph to show off would be the 6MWD scores. Here is a scale-accurate comparison of PACE participants vs healthy population. The lighter tips on the first 4 bars for the PACE groups represent the improvements, the red bar represents a conservative down-rounded figure of a 600m average for healthy females (since most PACE participants were female) and the dark red tip is a conservative average of 650m for healthy males.

attachment.php


If the rationale for GET was correct, we should expect a large improvement or even a return to the average of the healthy population, perhaps going further because of the "ex-patients" being encouraged to continue exercising as long as severe exacerbations are avoided. 12 months should be enough time to reverse the "deconditioning" that allegedly perpetuates symptoms of CFS. However on average, there was no such improvement in the PACE trial, so I think it is safe to say that the role of deconditioning, if any, is generally minor and has been grossly exaggerated. Despite the hyperbole, the PACE trial has instead demonstrated that the GET model endorsed by the researchers has been found wanting.

A picture can indeed be worth a 1000 words, but some statements can be better said with an audio file: http://www.soundjay.com/misc/fail-trombone-02.mp3

In the editorial, Bleijenberg and Knoop make the absurd claim that "PACE used a strict criterion for recovery"! PACE did originally had a more "strict" definition of "recovery" in the protocol, but since dropped it. Even people who have no exposure to ME/CFS should be wondering WTF? Bleijenberg and Knoop admit the evidence for "fear-avoidance" is weak, so they discuss "symptom focusing" instead. They don't seem too concerned that the research they cite also shows that these reported improvements to subjective fatigue are not resulting in increased activity. I think the biopsychosocialists are ignoring the objective measures so they can waffle on about "cognitions". They are very close to conceding this point, their own research shows it!

Just like the FINE trial can be used to kill off competition from the counselling alternative to CBT, the PACE trial will be used to kill off competition from the pacing alternative to GET. Perhaps they used a dubious equivalent of "pacing" to squash it? Bruce Campbell has noticed that elements of the CBT and GET used in the PACE trial are suspiciously similar to some aspects of pacing: http://www.cfidsselfhelp.org/library/pace-trial-shows-two-forms-pacing-more-effective-third-type

(edit: I removed the following image for being too large, but it is worth checking out: http://niceguidelines.files.wordpress.com/2011/02/photo-from-we-campaign-for-me.jpg)
 

Attachments

  • PACE_6MWD-comparison.jpg
    PACE_6MWD-comparison.jpg
    12.3 KB · Views: 76
  • PACE_PF-SF36_comparison-data_v1.jpg
    PACE_PF-SF36_comparison-data_v1.jpg
    20.2 KB · Views: 94

Dolphin

Senior Member
Messages
17,567
I'm confused by Web Appendix Table B
"Per protocol sample analysis of co-primary outcomes of fatigue and physical function"
I'd hoped this would show primary outcome analysis according to the protocol (ie what proportion of each group improved by 50% or more). But it seems very similar to Table 3 of the Lancet paper "Primary outcomes of fatigue and physical function", but with very slightly different values.

Any explanations gratefully received.
"Per Protocol" generally means that they stuck reasonably well to the protocol/treatment (for drugs, it would that one took most or all of the medication for example).

With "intention to treat" analysis which is the one used in the main text one has to count everyone one has any sort of results for.

Often "Per Protocol" results may be quite a bit better - it is interesting that in this case they're almost exactly the same (statistically I imagine they are exactly the same)
--------
It explains it a bit below:

This analysis included 556/640 (87%) participants.
Those excluded were: 3 found ineligible after randomisation, 78/640 (12%) who had received inadequate treatment, 2 treated at a different centre from the one at which they were randomised, and one both ineligible and with inadequate treatment.
-------------
In the main paper, one can see in Table 2, the line Adequate treatment
Adequate treatment was ten or more sessions of therapy or three or more sessions of specialist medical care alone.
------------
I was looking at those numbers last night, when they are reversed it might be interesting:
24 in the GET group didn't get adequate treatment
21 in the CBT group didn't get adequate treatment
16 in the APT group didn't get adequate treatment

To me, these are like figures for drop-outs.

P.S. I fixed up the typo in my last post - if you could quoting me, it'd be good - thanks.
 

Esther12

Senior Member
Messages
13,774
There are loads of good points in here, but I'm a bit worried that some might get lost.

I clumsily started a wiki here, to see if the wiki approach might be of any use, and people could use that to collate their points, rather than just having them in a discssion thread. http://forums.aboutmecfs.org/showwi...view+Project:Pace+-+analysis+dump&redirect=no

Doogle also posted about this wiki... which is off to a much better start, but I thikn can only be added to by those with an mecfsforums account:

http://www.mecfsforums.com/wiki/PACE_trial.

Or maybe we should wait til we've got a better idea of the key points, and then try to collect them all?
 

Dolphin

Senior Member
Messages
17,567
Well done on setting up the Wiki.

Or maybe we should wait til we've got a better idea of the key points, and then try to collect them all?
I think now is about the best time to do something as it is all fresh in our heads.
Saying that, I don't see myself being involved (have comments on a paper of mine from reviewers to deal with which I have ignored for three weeks) except maybe to read over things a bit so it's not my decision.
 

oceanblue

Guest
Messages
1,383
Location
UK
"Per Protocol" generally means that they stuck reasonably well to the protocol/treatment (for drugs, it would that one took most or all of the medication for example).

With "intention to treat" analysis which is the one used in the main text one has to count everyone one has any sort of results for.

Often "Per Protocol" results may be quite a bit better - it is interesting that in this case they're almost exactly the same (statistically I imagine they are exactly the same)


I was looking at those numbers last night, when they are reversed it might be interesting:
24 in the GET group didn't get adequate treatment
21 in the CBT group didn't get adequate treatment
16 in the APT group didn't get adequate treatment

To me, these are like figures for drop-outs.
Thanks for the 'per protocol' explanation, which makes things clearer. For one moment I'd thought they were actually going to give us results according to the protocol...

I agree those figures look like drop outs, but maybe they are people who skipped quite a few sessions along the way, but were there at the end?