• Welcome to Phoenix Rising!

    Created in 2008, Phoenix Rising is the largest and oldest forum dedicated to furthering the understanding of, and finding treatments for, complex chronic illnesses such as chronic fatigue syndrome (ME/CFS), fibromyalgia, long COVID, postural orthostatic tachycardia syndrome (POTS), mast cell activation syndrome (MCAS), and allied diseases.

    To become a member, simply click the Register button at the top right.

PACE Trial and PACE Trial Protocol

Dolphin

Senior Member
Messages
17,567
There is loss of information with dichotomous variables, or composite variable, both of which could be said to be problems with the original primary outcome measures.

However, it was they who came up with the such variables.

Also, their proposal presumably used such variables when the reviewers reviewed whether the MRC would fund it.

And similarly, when presumably used such variables when ethics reviewers reviewed it.

And it wasn't as if they gave up on dichotomous variables: the two post hoc variables they introduced, "normal functioning" and "improvement" were dichotomous variables.

Also, they already had a secondary outcome measure that used continuous scoring for the Chalder fatigue scale.

Given this and, for example, the drastic reduction in the recovery thresholds, it's difficult to believe it was anything other than running away from demanding thresholds that would give them not good results.

Also, and this has been asked (and maybe answered?) before, do we know whether they had seen all the data before making this change? There is a lot of talk somewhere about having data but not broken down by intervention, but I can't remember whether we know what they knew before making this change?
 

Esther12

Senior Member
Messages
13,774
They said:

Lancet PACE:

The statistical analysis plan was finalised, including changes
to the original protocol, and was approved by the trial
steering committee and the data monitoring and ethics
committee before outcome data were examined.

re most of what @Dolphin said: I'd have no problem with them choosing to release data as they did in addition to the outcome measures from the protocol... they could have then argued that these new outcome measures were of greater value with all of the data available for people to assess for themselves. But their refusal to release the outcome measures they originally developed does look just like "running away from demanding thresholds that would give them not good results."
 

biophile

Places I'd rather be.
Messages
8,977
@Dolphin . The definitions for a 'clinically useful difference' (and 'normal range' in fatigue or physical function) on an individual level were not mentioned in the Statistical Analysis Plan and are described as post-hoc in the Lancet paper.

The normal range was introduced during peer-review, so they submitted the paper without it. It is unclear whether the reviewer specified the exact same normal range that White et al used or just suggested it in general. It is unknown when the post-hoc 'clinically useful difference' (individual level) was added, but it is described as 'post-hoc'. They claimed to the Lancet (in response to Hooper) that "we defined clinically useful differences before the analysis of outcomes", but they seemed to discuss group differences not individual differences. Group CUD was introduced in the SAP and not apparently described as post-hoc in the Lancet paper, whereas individual CUD was not mentioned in the SAP and is described as post-hoc in the Lancet paper, so it is plausible that individual CUD was introduced after being unblinded to the data in general.

Then there is the revised criteria for 'recovery' which was based on the same post-hoc 'normal range' first introduced when the February 2011 Lancet paper was undergoing fast tracked peer-review. They claim in the 2013 recovery paper that the criteria for recovery was changed before doing the analyses for that paper, but failed to mention that they had already known about the normal range outcome and already knew the mean(SD) of physical function scores in general. It would not take a genius to figure out from just looking at those figures and other results known in 2010/2011 that the unofficially expected recovery rate of 25% for CBT/GET was looking in serious doubt if using the original criteria for recovery.

All their main outcomes for individual clinical improvement (and recovery) for fatigue and physical function appear to have been introduced *after* being unblinded to data in general. If this was a drug trial designed and conducted by people with careers partly built on two of the drugs being tested, there would be an uproar, but instead we are told that PACE was held up to the highest standards and is definitive evidence and that the principal investigators were 'utterly impartial'. Given the numerous published blunders associated with the normal range in physical function, there appears to have been a severe lack of scrutiny. Not to mention that changes were apparently not approved by the relevant trial oversight committees.

When you say talk of having the data but not broken down by intervention, I think you meant for the purposes of monitoring safety? There are additional cues, conscious or subconscious, which could have affected decisions to change the thresholds, besides of course the disappointing data itself. The FINE Trial tested similar therapies and was essentially a null result. And as I think you have mentioned before, there was little stopping those involved from getting general impressions from other staff about how the trial was going, i.e. much worse than anticipated.

There is no doubt the original goalposts would have given very sobering results. I agree with Esther12 about releasing both sets of outcomes for comparisons, instead of the resistance and stonewalling we have witnessed instead. Their reasoning for changing the physical function threshold for recovery has also been debunked.
 
Last edited:

Sean

Senior Member
Messages
7,378
I'd have no problem with them choosing to release data as they did in addition to the outcome measures from the protocol... they could have then argued that these new outcome measures were of greater value with all of the data available for people to assess for themselves. But their refusal to release the outcome measures they originally developed does look just like "running away from demanding thresholds that would give them not good results."

Me too. Got no problem with different analyses being done on the same data. But the original analysis plan must be delivered, in addition to any alternative post-hoc analysis. (Either that or the data must be released so others can do the original analysis.)
 

Dolphin

Senior Member
Messages
17,567
(no major surprise)
Healthy Controls in an ME/CFS study had average SF-36 PF scores of 95

from:

A piece by Cort Johnson on the IACFS/ME conference:

Epidemiology I: the Big (Big) Study

The people in the CFI’s Biobank aren’t necessarily your typical patients. Dr. Peterson threw his immune subset in there, and other doctors probably included their more severely ill patients. Indeed, all the patients were reported to be severely ill; 99% had PEM and most met the Canadian Criteria.

The vitality scores were of the ME/CFS patients were three times lower than those obtained from a chronic heart failure study.

Their vitality scores from the SF-36 were alarmingly low — a mere 14.5 compared to 77 for the healthy controls. It’s hard to wrap one’s head around such a low vitality score; to get a sense of how low that score is in the medical arena, the vitality scores of German chronic heart failure patients were 45.6 –three times that of the ME/CFS patients. Their physical functioning score (36) was almost 50% lower than found in heart failure patients (57), and was a third of the the score of healthy controls (95%).

The CFI Biobank clearly contains some very ill patients.
 

Dolphin

Senior Member
Messages
17,567

Bob

Senior Member
Messages
16,455
Location
England (south coast)
OK, I'm sure I'm being incredibly stupid, and have possibly completely misinterpreted this, but I think we've missed this haven't we? (And, if so, how the heck did we manage to miss it?)

PACE Trial

Cohen's d effect size.

CBT vs APT 0.33 (CI 95% 0.10, 0.56)

GET vs APT 0.28 (CI 95% 0.06, 0.51)


It doesn't specificy if this is fatigue or physical function or combined fatigue and physical function. Or some other measures.

Can anyone guess where I found it? ;)


Edit: @biophile gets the prize.

It's from the Castell et al. meta-analysis:

Castell, B. D., Kazantzis, N. and Moss-Morris, R. E. (2011), Cognitive Behavioral Therapy and Graded Exercise for Chronic Fatigue Syndrome: A Meta-Analysis. Clinical Psychology: Science and Practice, 18: 311–324.
http://onlinelibrary.wiley.com/doi/10.1111/j.1468-2850.2011.01262.x/abstract
 
Last edited:

Bob

Senior Member
Messages
16,455
Location
England (south coast)
BTW, I interpret these as 'small' effect sizes, not 'moderate'.


And, looking at the results in the PACE trial paper, I can't imagine that the effect size would change much with CBT vs SMC and GET vs SMC.
 

biophile

Places I'd rather be.
Messages
8,977
Yay! At first I did a Google search but that was not successful. Then I vaguely remembered that paper having similar outcomes for CBT/GET in general so I had a closer look. I'm not sure if we have talked about it yet, I think I have seen those results before but probably ignored them because it was compared to APT rather than SMC.

Interpreting Cohen's d is arbitrary. Also, the PACE Trial recruitment process decreased the standard deviation in the scores and this could have increased the apparent size of Cohen's d without the actual effect being larger.
 

Bob

Senior Member
Messages
16,455
Location
England (south coast)
Yay! At first I did a Google search but that was not successful. Then I vaguely remembered that paper having similar outcomes for CBT/GET in general so I had a closer look. I'm not sure if we have talked about it yet, I think I have seen those results before but probably ignored them because it was compared to APT rather than SMC.
:) I think you deserve a phoenix rising prize for that bit of detective work! :)

I can't remember us discussing it before, but I have sometimes got a very bad memory.
I've looked at the Castell paper many times, and I'm sure i must have looked at Table 3 in the past!
 

Dolphin

Senior Member
Messages
17,567
It doesn't specificy if this is fatigue or physical function or combined fatigue and physical function. Or some other measures.
Paper says
Four outcome categories were used to estimate the effect of each treatment on fatigue, anxiety, depression, and functional impairment. The Hospital Anxiety and Depression Scale was the most common measure of mood, while the Chalder Fatigue Scale and the SF-36 were the most commonly used measures of fatigue and functional impairment, respectively. A complete list of the measures used to represent each category is available from the corresponding author. Separate effect sizes were calculated for each relevant outcome measure. As a result, up to four effect sizes originated from each study. In the primary analysis, these effect sizes were aggregated (assuming dependence), so that each study contributed a single weighted ES to the overall estimate of effect. Effect sizes were calculated for post-treatment outcomes only, as sufficient follow-up data to calculate effect sizes were often omitted from reports.
 

biophile

Places I'd rather be.
Messages
8,977
I don't think it's entirely arbitrary, is it?

This is the standard interpretation:

d=0.2 (small effect)
d=0.5 (moderate effect)
d=0.8 (large effect)

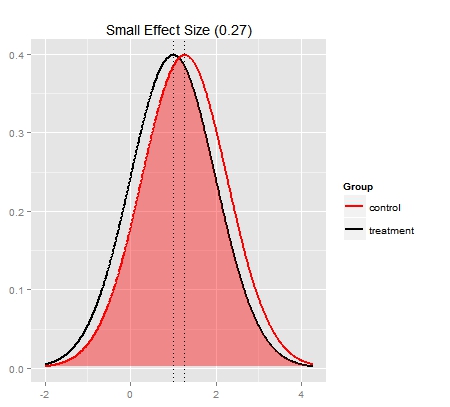
If I recall, the 'standard interpretation' was just a very rough guideline from Cohen himself (who also suggested that the interpretation depends on the outcomes being measured), but it has just been lazily parroted without much consideration. The advantage of Cohen's d and similar versions is that various outcome measures can be combined. However, the result is not particularly intuitive. In a previous Phoenix Rising article, Simon gave a helpful visual of what d=0.27 looks like:


As I said before though, I am weary about how it depends on the standard deviation.