• Welcome to Phoenix Rising!

    Created in 2008, Phoenix Rising is the largest and oldest forum dedicated to furthering the understanding of, and finding treatments for, complex chronic illnesses such as chronic fatigue syndrome (ME/CFS), fibromyalgia, long COVID, postural orthostatic tachycardia syndrome (POTS), mast cell activation syndrome (MCAS), and allied diseases.

    To become a member, simply click the Register button at the top right.

Public ME/CFS Data Collection Website

sparklehoof

Senior Member
Messages
186
Location
North Carolina
Hi,
I've been looking around to see if currently there is an active public database for which patients with ME/CFS can enter their lab results anonymously so that they can be used to make graphs that could help us to see pseudo scientific trends. I haven't found one and so I've been trying to start one. If anyone is interested in helping me I would love that!
Right now, based on the premiss that a site like this doesn't exist, I'm starting to put together an outline of how one would work and I'd love to hear your input.

1. As of 2016 do we have an official-up to date international diagnostic criteria list?
2. My thought is that to start, we can ask a list of questions to loosely evaluate if the participant meets the most current diagnostic criteria. Those who meet/say they meet the criteria will continue with the questionnaire.
3. What questions do we want to ask? Age, gender, diagnosis/es, how long have you been ill?, What was the age of onset....
4. Which lab results do we want to plot into the public data graphs? (lab results will need to be entered in a standard unit of measure with a single reference range.)
Thanks!
 

minkeygirl

But I Look So Good.
Messages
4,678
Location
Left Coast
Are you aware that different countries have different names for some labs? That different labs use different reference ranges, and some countries don't even use reference ranges ? Example australia does not use ranges for some tests. It's either positive or negative (some Aussies please correct me or clarify).
 

sparklehoof

Senior Member
Messages
186
Location
North Carolina
@minkeygirl- I appreciate your comments. Would you be interested in helping me to strategize and make a formula for this?

l had written lab results will need to be entered in a standard unit of measure with a single reference range just because I haven't yet figured out how to accommodate for such a large amount of variables, but with your help maybe we can do it?
 

Mark

Senior Member
Messages
5,238
Location
Sofa, UK
Phoenix Rising has been wanting to run a project a bit like this for ages (not sure if it's the same thing, but our idea would include test results). Several attempts have been made, and we have made quite a lot of progress I think, but to do it properly is a significant project. We do have a kind of prototype though, which I wrote a few years ago based on the analysis we'd done up to that point...it isn't working properly at the moment because some components it's based on need updating, but if you'd be interested in working on this as a Phoenix Rising project you'd be most welcome to pick the project up where we last left off...it would be a good time to do so, I think, as I think we're in a better position now to move forward on this than we have been when we've tried in the past.

OpenMedNet, from the Open Medicine Institute, looked like it was all set to do the whole thing brilliantly, and maybe it does, but as I recall it, it strangely didn't seem to actually launch (after Andreas Kogelnik had told us about it at Invest in ME conference) and the link to it here doesn't seem to be working...anybody know what's going on with OpenMedNet?
http://www.openmedicineinstitute.org/
 

minkeygirl

But I Look So Good.
Messages
4,678
Location
Left Coast
@minkeygirl- I appreciate your comments. Would you be interested in helping me to strategize and make a formula for this?

l had written lab results will need to be entered in a standard unit of measure with a single reference range just because I haven't yet figured out how to accommodate for such a large amount of variables, but with your help maybe we can do it?

Sorry no can do. Too sick and not that interested. Just wanted to point out a potential stumbling block.
 

sparklehoof

Senior Member
Messages
186
Location
North Carolina
Thanks for your support minkeygirl. It was nice of you to mention potential problems even though you're not interested and very sick. I'm sick too. Maybe there are too many potential problems and not enough interest for this idea to work.
 

sparklehoof

Senior Member
Messages
186
Location
North Carolina
Phoenix Rising has been wanting to run a project a bit like this for ages (not sure if it's the same thing, but our idea would include test results). Several attempts have been made, and we have made quite a lot of progress I think, but to do it properly is a significant project. We do have a kind of prototype though, which I wrote a few years ago based on the analysis we'd done up to that point...it isn't working properly at the moment because some components it's based on need updating, but if you'd be interested in working on this as a Phoenix Rising project you'd be most welcome to pick the project up where we last left off...it would be a good time to do so, I think, as I think we're in a better position now to move forward on this than we have been when we've tried in the past.

OpenMedNet, from the Open Medicine Institute, looked like it was all set to do the whole thing brilliantly, and maybe it does, but as I recall it, it strangely didn't seem to actually launch (after Andreas Kogelnik had told us about it at Invest in ME conference) and the link to it here doesn't seem to be working...anybody know what's going on with OpenMedNet?
http://www.openmedicineinstitute.org/
Thanks so much for posting Mark. How are you? You and I had talked about working on this once before some time ago and then my health took a nose dive and I couldn't keep up. I'm glad that you think it's a good idea and that others do too. After reading minkeygirl's no-can-do and not that interested post, I was feeling discouraged. She seemed to have some knowledge about international testing. I've found that even with my personal labs that were done in the US by different companies sometimes use different units of measure. I believe I spoke with someone from Quest Diagnostics last year and that person said that there isn't a conversion. Is this something that you guys have run into and or found a work-around? Unfortunately, my health is still an obstacle. I have a tendency to feel some relief for 20 minutes and dream of big projects. I'd love to check out what you have so far. I don't have a background in the sciences but I'll give to the project however I can. Thank you again for posting- I feel better knowing that I'm not the only one interested. I also contacted Joshua, the creator of mendus.org and asked him if he has any plans to record test results. I saw his site for the first time today and he had implemented may of the ideas that I had and has been taking into to another direction with research proposals. Has Phoenix Rising already contacted him about this? In theory both sites could gain increased visibility if we worked together.n
 

sparklehoof

Senior Member
Messages
186
Location
North Carolina
This site may be helpful for your project:

http://www.mendus.org/
Thank you for sharing this site-- I was elated to see that this was already being done and since the creator is a neuroscientist with MECFS he seems like the ideal person to do it. I asked him if he has plans to set up a section for test results. Thank you again for sharing- it was spot on!
 

*GG*

senior member
Messages
6,389
Location
Concord, NH
Patients Like me does data collection, not sure it's what you are thinking Some ME/CFS and Fibro people etc on that site as well.

GG
 

Hutan

Senior Member
Messages
1,099
Location
New Zealand
The different reference result ranges given by labs can possibly be handled by expressing the individual's results relative to the reference ranges. e.g. if the reference range is 100 to 200
the categories could be:
very low: less than 80 (ie 100- (20% x 200/100) )
low: 80 to 100
low normal: 100 to 120 (100+ (20% x 200/100)
normal: 120 to 180
high normal: 180 to 200
high: 200 to 220
very high: more than 220

I use this approach to colour my test results so I can see trends over time.

While there will be some issues on relativity between tests, the problem isn't insurmountable. If people are asked to enter the reference range and the result, the collection software can do the rest.

It's a big task to make software from scratch though.

@ggingues, thanks, will have a look at that Patients Like Me.
 

sarah darwins

Senior Member
Messages
2,508
Location
Cornwall, UK
I guess the biggest problem of all is diagnosis.

I flirted with Patients Like Me a few years ago but gave up when I realised I had no way of knowing how many of those patients actually were 'like me'.

Presumably, a database of this kind would require a comprehensive and carefully devised questionnaire to try to nail down subsets of patients.
 

sparklehoof

Senior Member
Messages
186
Location
North Carolina
I guess the biggest problem of all is diagnosis.

I flirted with Patients Like Me a few years ago but gave up when I realised I had no way of knowing how many of those patients actually were 'like me'.

Presumably, a database of this kind would require a comprehensive and carefully devised questionnaire to try to nail down subsets of patients.
Thanks Sarah- I agree with you completely and had the same thoughts when I used PLM. I posed the question to the group about what diagnostic criteria to use to screen patients for the database. Ideally, if I go through with working on the site, I could ask a series of multiple choice questions that would determine loosely (that if answered honestly and accurately) could help us to reach a particular cohort(s). I checked out mend us.org last night and Josh the creator is a neuroscientist with ME/CFS in Germany. He created a 100 question survey- I think that perhaps some of these questions could be helpful for this project as well.
 

sparklehoof

Senior Member
Messages
186
Location
North Carolina
The different reference result ranges given by labs can possibly be handled by expressing the individual's results relative to the reference ranges. e.g. if the reference range is 100 to 200
the categories could be:
very low: less than 80 (ie 100- (20% x 200/100) )
low: 80 to 100
low normal: 100 to 120 (100+ (20% x 200/100)
normal: 120 to 180
high normal: 180 to 200
high: 200 to 220
very high: more than 220

I use this approach to colour my test results so I can see trends over time.

While there will be some issues on relativity between tests, the problem isn't insurmountable. If people are asked to enter the reference range and the result, the collection software can do the rest.

It's a big task to make software from scratch though.

@ggingues, thanks, will have a look at that Patients Like Me.
Thank you- I think that your strategy sounds like a good one. I was looking at this site a little last night http://ask.metafilter.com/252841/Bl...alize-values-over-time-between-different-labs and it sounds similar to your idea. I was also trying to get a better understanding about why laboratories haven't created reporting standards that work in conjunction with one another more so as to increase the accuracy of patients and doctors who want to most accurately track their labs. I read that one reason is that labs use local results for their reference ranges. I would have thought that they would also use national or international reference ranges on the results. There are other factors besides 'brand' that can also cause variation. Assume a lot of the variation that you see in most analytes is not due to your own overall levels varying, but to normal variation in the test procedure itself. I'm wishing that I had a background in the sciences for the purposes of this project idea- I can tell that I have a lot to learn:)
 

MeSci

ME/CFS since 1995; activity level 6?
Messages
8,231
Location
Cornwall, UK
This is by no means a rigorous or scientific database, but there is an ongoing poll created by someone here on how people have responded to various supplements, which may interest you.

I wish that more people would complete it!

(Having said that, I have probably forgotten to fill it in re some supplements.)
 

undiagnosed

Senior Member
Messages
246
Location
United States
I'm PMing with Sparklehoof; I think there are one or two options here for us to get things moving again on this project. If anybody might be interested in helping out, please contact me.

Hey,

I'd potentially like to get involved. It would be really nice to have publicly available data for symptoms, labs, etc in a structured format. I'd be interested in including any undiagnosed or diagnosed condition for which the user has data available. If you have been diagnosed with CFS, you could mark that. It seems that getting access to any data is a major pain, correct me if I'm wrong. I've seen the CDCs Chronic Fatigue Syndrome Wichita Clinical Study http://www.cdc.gov/rdc/b1datatype/dt136.htm, but it looks like you have to write a proposal and go through some kind of process to get the data. I am interested in doing some data analysis as are some other users I've seen here. Here are a couple things I've seen mentioned or thought about.

1. Explore data trends

I've seen questions come up on the forums like how prevalent low ESR really is in CFS patients http://forums.phoenixrising.me/index.php?threads/esr-always-low-in-me.19139. We could explore questions like these to the extent that the underlying data can be trusted.

2. Find CFS subclasses

I'd be interested in seeing if we can identify any meaningful subclasses of CFS based on the data. I've read that researchers hypothesize it to be a multifaceted disease brought on by various triggers. Maybe it would be possible to identify groups that have more in common with each other.

I took a look at PatientsLikeMe which seemed to address a number of the ideas mentioned earlier in the thread. However, I noticed some major issues that make it a show stopper for me anyways. Here are the problems from my perspective:

- No open access to data
- Not possible to do independent research analysis
- Primitive filtering for patients
- Can't filter on lab results (ie. find people with ESR < 3)
- Matching filter should include match % w/ indications (like dating site or similar)
- Labs must be input manually
- Parse PDFs / pictures would be nice

Here is my proposal:

- Local utility to import clinical, lab, etc. data into sqlite database
- Share sqlite database file on p2p network
- Local utility to import data for analysis in open source tools such as R
- Tracker URL can be put in people's profiles on sites like Phoenix Rising, etc.
- Can easily e-mail,etc. your data to anyone
- Tracker website to show all data & allow searching / visualization

Pros
- Data is distributed and freely available, not controlled by any middleman
- Takes advantage of a lot of open source tools to reduce workload for implementation
- Records can be easily communicated
- Does not rely on any particular website, can share data across multiple forums, etc.

Cons
- Not as easy to use as a standard server based website

There is a lot more thought that has to be put into this, but let me know if you guys think this is a direction you'd be willing to try.
 

undiagnosed

Senior Member
Messages
246
Location
United States
I developed a visualization tool in R for evaluating measurements with respect to a reference range that some of you may find useful. I am thinking about developing a web app and can link to code if anyone is interested.

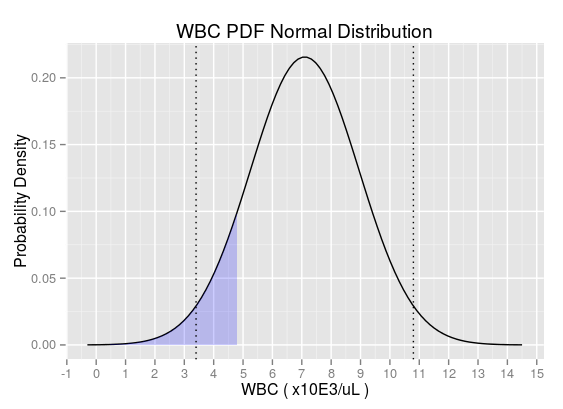
It assumes that the reference range represents the middle 95% of the reference population from a normal distribution. So given the lower bound, upper bound, and result, a graph can be created. Here are example values:

Test Result Units Reference Range
WBC 4.8 x10E3/uL 3.4-10.8

Here is the resulting graph:
a9AT7Zo.png

The graph plots the Probability Density Function (PDF) for the data. The dashed vertical lines show the lower and upper bounds, representing 2.5% lower and 2.5% upper population not accounted for in the middle 95%. These are the lower and upper bounds that were specified. The area shaded under the curve represents the cumulative probability which is used to determine the probability at or below the result in the reference population.

P(X<=4.8) = 0.1068

Thus, there is a 10.7% chance of the result being 4.8 x10E3/uL or less in the reference population.