http://www.goodmedicine.org.uk/stre...emotion-processing-chronic-fatigue-syndrome-c
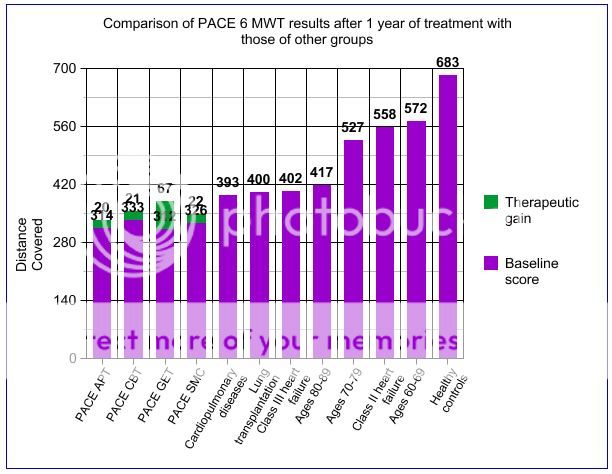
I'm not sure if this has been posted before. It's one of the few references I've seen to the step test, the results of which have so far not been published. The walking test is presumably the six-minute walking test.
I'm not sure if this has been posted before. It's one of the few references I've seen to the step test, the results of which have so far not been published. The walking test is presumably the six-minute walking test.
Leeds BABCP conference: workshop on emotion processing in chronic fatigue syndrome - current CBT treatment results (2nd post)
[..]4.) Encouraging & monitoring increases in activity are central to this therapy approach. See the GET manual for more information on exercise assessment and the CBT manual or books like Trudie's "Overcoming chronic fatigue: a self help guide"for more general comments. Cella, Sharpe & Trudie published a paper last year - "Measuring disability in patients with chronic fatigue syndrome: reliability and validity of the Work and Social Adjustment Scale" - highlighting the potential value of the widely used WSAS as a disability measure in chronic fatigue (and as a tool to help in discussion of activity targets). Initial WSAS scores in two fatigue cohorts treated at specialist centres were 27.2 (SD 6.3) and 26.9 (SD 8.5). The scores decreased significantly in severity and did so at approximately the same (fairly slow) rate that the Chalder Fatigue scores decreased - with the final WSAS ratings getting to the high teens by one year follow-up. Interestingly correlation with objective measures of physical activity improvement (e.g. walking & step tests) was only weak, highlighting how disability assessment is likely to be quite strongly coloured by factors like anxiety & depression. The WSAS is downloadable from the "Increasing access to psychological therapies (IAPT) outcomes toolkit" page of this website, where you'll also find other helpful measures.